Have you ever wondered if people like to watch your Facebook videos? How many of them left your Story video? Did he even see it till the end?
These are all great questions to ask when you’re using video for your Facebook marketing strategy. And your Facebook video metrics can give you the answers you need.
Understanding your Facebook video metrics will help you better understand how well people are responding to your content. It can help you gauge the results of your campaign and understand how well your investment is paying off. You can also use this information to increase the reach, engagement and ROI of your next video.
So what video metrics do you need to track on Facebook? In this post, we’ll give you an analysis of the most important metrics you should measure for your brand.
How to Find Facebook Video Metrics
There are a few ways you can access the Facebook video metrics for your organic posts.
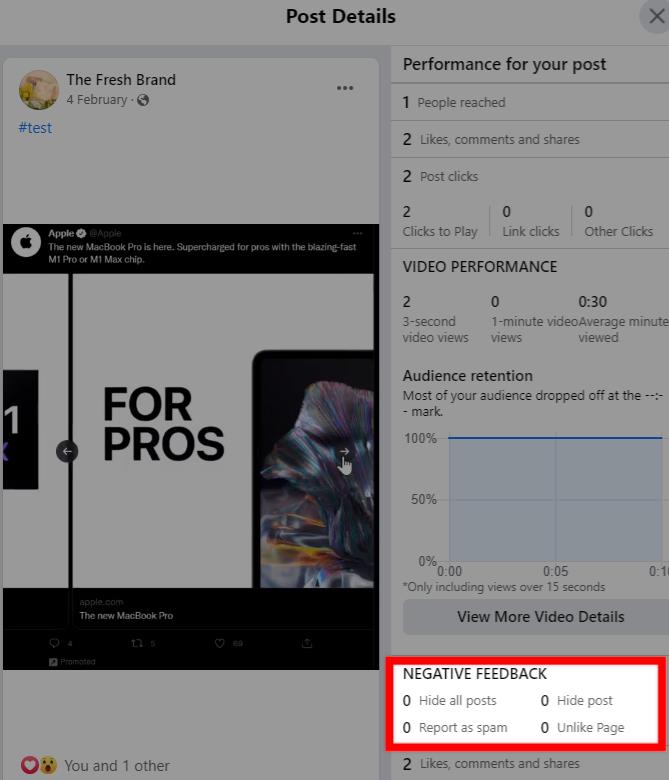
To see individual post performance for each video, click one of the metrics that appears under each post. This will open a more detailed view of all the metrics associated with the video.

Another option is to view these metrics from your video library. Click the “More” button at the top of your page and select “Videos.” From here, you can view all the videos you’ve posted and easily select the one you want to analyze.

You can see your most popular videos highlighted at the top of the page. Scroll down to see all the videos you posted. Once you find the video you want to analyze, click the “…” button below the video. Then select “View Insights” to open the detailed metrics page.

Additionally, your Page Insights will give you access to other Facebook video metrics such as Facebook Story metrics and Facebook Live metrics. All of your video ad metrics can be accessed from Facebook Ads Manager.
What are good video metrics to track on Facebook?
When it comes to the performance of your Facebook videos, you don’t need to meet any set standards. What counts as “good” depends on your industry, the size of your following, and your past video performance. For example, 1,000 might be a low number for a brand with 10,000 followers. But this is a good number for a brand with 2,000 followers.
Ideally, you should use your own data as a Facebook video benchmark so you can compare how your performance changes over time.
1. Video views
This metric tells you how many times people have watched your video. Your Facebook video views give you an accurate picture of how your video performed because it’s beyond reach. This means that it not only shows you how many users viewed your video in their feed, but how many of them actually watched the video.
Keep in mind that this Facebook video metric considers all video views—even those that last only a few seconds. So it doesn’t give you a complete picture of your video performance. But it does give you a Facebook video view rate benchmark that you can use in your campaign measurement.

Does rewatching a Facebook video count as one view?
To avoid skewing data, Facebook only counts seconds viewed as the number of views. This means that even if someone rewatches the video, Facebook will only count it as one view.
2. Engagement
Engagement is an important metric to track all types of Facebook video, including in-feed videos, Stories, and Live. It measures the number of times people interacted with your video through likes, comments and shares.
In the case of Facebook Stories, the native analytics tool looks at all the engagement data for the past 28 days. It counts engagement actions like reactions, sticker interactions, swipe-up actions, profile taps, replies, and sharing.
This helps you understand how much the content resonates with your audience. What types of videos see the most engagement? Thus, engagement data can serve as a Facebook video benchmark to inform your video content strategy.
3. Audience Retention
This Facebook video metric shows you when viewers started leaving while watching your video. So you can read exactly how well you have managed to retain an active viewing audience of your video. And you can even indicate which sections of the video potentially turned them off.

4. Negative Feedback
Are people reacting negatively to your videos? Negative feedback includes hiding your post, reporting it as spam, or disliking your page. This is an important metric to track because it helps you identify problematic content that is losing your fan’s attention.
In many cases, videos with negative feedback can put your brand’s reputation at risk. That’s why it’s important to review them quickly and get to the root of the problem.
5. Top Positions and Top Viewers
Viewer demographics information such as Top Position and Top Audience can help you learn more about your target audience. These metrics give you an idea of what kind of people you should be targeting. And they inform how you should optimize your messaging and marketing approach.
6. Swipe-up Actions
This metric is specific to Facebook Stories. Swipe-up actions show you how many times people took an action from your stories by swiping up on a link or action button. For example, people can swipe up to “Shop Now.” It’s a useful metric to understand how influential your stories are and how effectively they drive conversions.

7. Saves
Another story-specific metric to track are saves, which are measured by the total number of people who have saved your story videos to their Facebook archives. This is a good indicator of how important your stories are to your audience.
8. Peak Live Viewer
This metric is specific to Facebook Live and shows you the most viewers while your video is live. You can expand this metric to see a graph of how this audience changes throughout the live broadcast. So it gives you a clear idea of when the audience starts to leave.
This data can help you find out if viewers are getting restless during a broadcast that is taking too long. Or it could be a sign that you need to make some changes to your broadcast timing so that more people can tune in for the whole thing. It can also be an indicator of the quality of the material itself.

9. Average Completion Rate
Closely related to the previous metric, Average Completion Rate helps you understand how many people watched your live video by the end. A low average completion rate suggests that your live broadcasts may not be engaging or executed well enough. Or you may have broadcast at a time when people were too busy to watch the whole thing.
You’ll have to find out the specific reason for this low completion rate and experiment with tips to make your live broadcast more engaging.
10. Page Growth
As you create more engaging video content, you will gradually see your fan following increase. Make sure you are using Facebook Video Benchmark to understand how your content is affecting your page likes.
Facebook also gives you the option to measure page growth so that you can see how many followers you get after a live video session. This is a helpful metric for understanding the impact of your live broadcast, so you know what’s working and what drives people to “like” your page.
11. Advertising Engagement
If you’re running a Facebook video ad campaign, you should also keep a close eye on your ad engagement metrics. How are people reacting to your video ads? This is an important question to ask if you want to maximize the impact of your ads and get the most out of your investment.
How much time are they spending watching your video ads? And how many times have people messaged your business after seeing your ad? You can view these important video ad metrics using Ads Manager.
To get a more detailed view of your video ad engagement, you can also use the Sprout Social Facebook Paid Performance Report. This gives you an overview of how much engagement your ads received. Plus, you can also see the number of clicks and web conversions generated by your ads. So you can use this data to better understand your campaign performance and look for opportunities to optimize your Facebook video ads.

12. Advertising Cost (CPM, CPE, CPC, CPCON)
In addition, you should also measure how much you are spending on your Facebook video ads. The Facebook Pay Performance report gives you a detailed breakdown of your ad spend. It shows you how much you are spending on your ads in relation to various performance metrics.
For example, you can see cost per impression, cost per engagement, cost per click and cost per web conversion. These are all essential metrics to get a complete picture of your ad spend and ultimately your overall campaign performance.
Get started tracking and growing with Facebook Video
As brands strive to stand out from the competition, video marketing is only going to grow in popularity. Marketers are seeing a lot of value from using video on Facebook. According to Sprout Social’s Index Edition XVII: Accelerate, 54% of marketers agree that video is the most valuable content type for achieving their social media goals.
If you’re going to get the most out of your Facebook video marketing efforts, you can’t miss the all-important performance insight. So make sure you’re regularly tracking your performance using the key Facebook video metrics we’ve shared above.
And if you want to learn more about the impact of video, Facebook, and everything in between, download the latest Sprout Social Index report.
The post 12 Facebook Video Metrics Brands Need to Benchmark Right Now appeared first on Sprout Social.