Facebook is a preferred social network by marketers, not only because of the sheer number of users represented but also because of its analytics capabilities. While Facebook discontinued Facebook Analytics on June 20, 2021, you can still get the marketing analytics you need using other tools.
Here’s a step-by-step guide on how to conduct a deep Facebook analysis now that native Facebook Analytics was sunset.
4 Facebook Analytics tools you can still use
The demise of Facebook Analytics didn’t have a sweeping impact on marketing intelligence. That’s because other tools—both within and outside of Facebook—deliver many similar functions.
You can still gather important user metrics and manage your Facebook and Instagram profiles with the following platforms and analytics tools:
Meta Business Suite
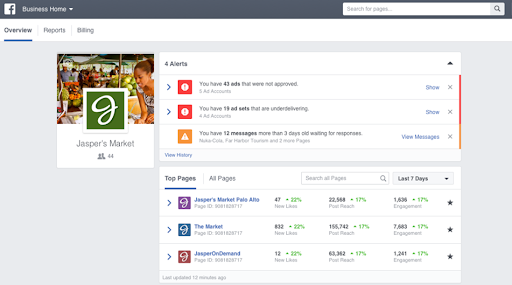
Meta Business Suite (also known as Business Manager) is a free tool companies can use to manage Facebook and Instagram profiles and ad accounts. Within a single platform, administrators can manage multiple Pages and ads, respond to messages, and define and track marketing goals.
Key features:
- Ad retargeting
- Lead generation
- Posts for building brand awareness
- Dynamic Instagram Shop ads
- User roles and permissions
Creator Studio
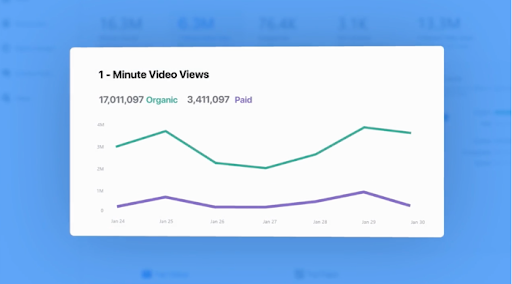
Creator Studio is a Facebook and Instagram video management platform that provides engagement data and viewer demographics. Businesses can also use this platform to monetize videos with in-stream ads and earn money from Meta when fans interact with live content.
Key features:
- Viewer loyalty insights
- Benchmarking feature for comparing video metrics with other Facebook Pages
- Conversation metrics for calls to action in Instant Articles
- Hourly performance data for 48 hours after video publication
- Viewer source information
Facebook Audience Insights
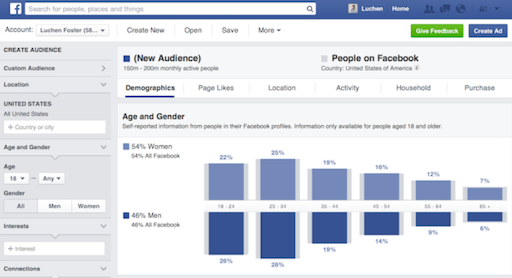
Facebook Audience Insights reveals current and potential customer trends, with data presented in an aggregated format to protect individual user privacy. You can view this information based on three groups: people connected to your Page or event, the general Facebook audience or people in your previously created custom audiences.
Key features:
- Past purchase behavior
- User location and language
- Top user page likes by category
- Detailed demographics including education level and job titles
Sprout Social
Sprout Social is a user-friendly platform that streamlines social media management for Facebook, Instagram and other social media channels. In addition to providing detailed analytics data, Sprout Social includes social listening tools for tracking brand mentions, consumer sentiment and competitor activity. It also reveals how fan growth correlates with content performance and includes historical engagement data that helps administrators optimize post-scheduling times.
Key features:
- Unified social inbox
- Review management
- Average positive sentiment score and sentiment trends
- Conversation histories
- Trending topic identification
- Competitor comparisons
- Cross-network social scheduling
- Built-in approval workflows for compliance and collaboration
How to perform a deep Facebook analysis
In this section, we’ll walk through a 6-step process you can use to analyze Facebook page data and competitors along with how to use those insights to improve channel performance.
1. Analyze Your Competitors
The Facebook Insights data attached to your Facebook Business Page will provide you with a wealth of information, but it’s a good idea to start your Facebook analysis by looking at your competitors.
Find Your Competitors
For this part of your Facebook analysis, there are three kinds of posts that you’ll want to scrutinize for insights: posts related to your industry, your competitors’ posts and your own posts. If you’re not sure who’s your competition, here are a few strategies to incorporate during your research:
- Find them on Google. Use Google to search for key phrases relating to what you do. If your business is not local, you can use search terms that best describe your industry.
- Look at who your audience follows. Check out the other brands your audience follows on social media and note the most similar to your company.
Analyze What They’re Doing
Once you’ve identified your top competitors:
- Choose the top 3-5 competitors to benchmark your efforts against.
- Gather information about them, including the social networks they use, the size of their following, how often they post and what their engagement numbers are like.
Manual competitor analysis is a tedious process. But with Sprout Social, users have access to our Facebook Competitors Report. This report shares audience growth numbers, so you can track fan count by day and message volume to see how active the competition is on Facebook.
Perhaps the most useful aspect of the analysis is the message volume chart that includes overall posting volume, a breakdown of post types, total engagement and engagement per post. This data will help you to benchmark your efforts against competitors and may provide some motivation to renew your campaigns on the platform.
Few things are more motivating than the numbers of your competition staring you in the face.
Audience growth:
Using Sprout’s Facebook Competitors Report, you can see how your audience growth compares to that of your competitors. You can also view competitive averages for messages sent and received, and per-post engagements.
Post frequency and engagement:
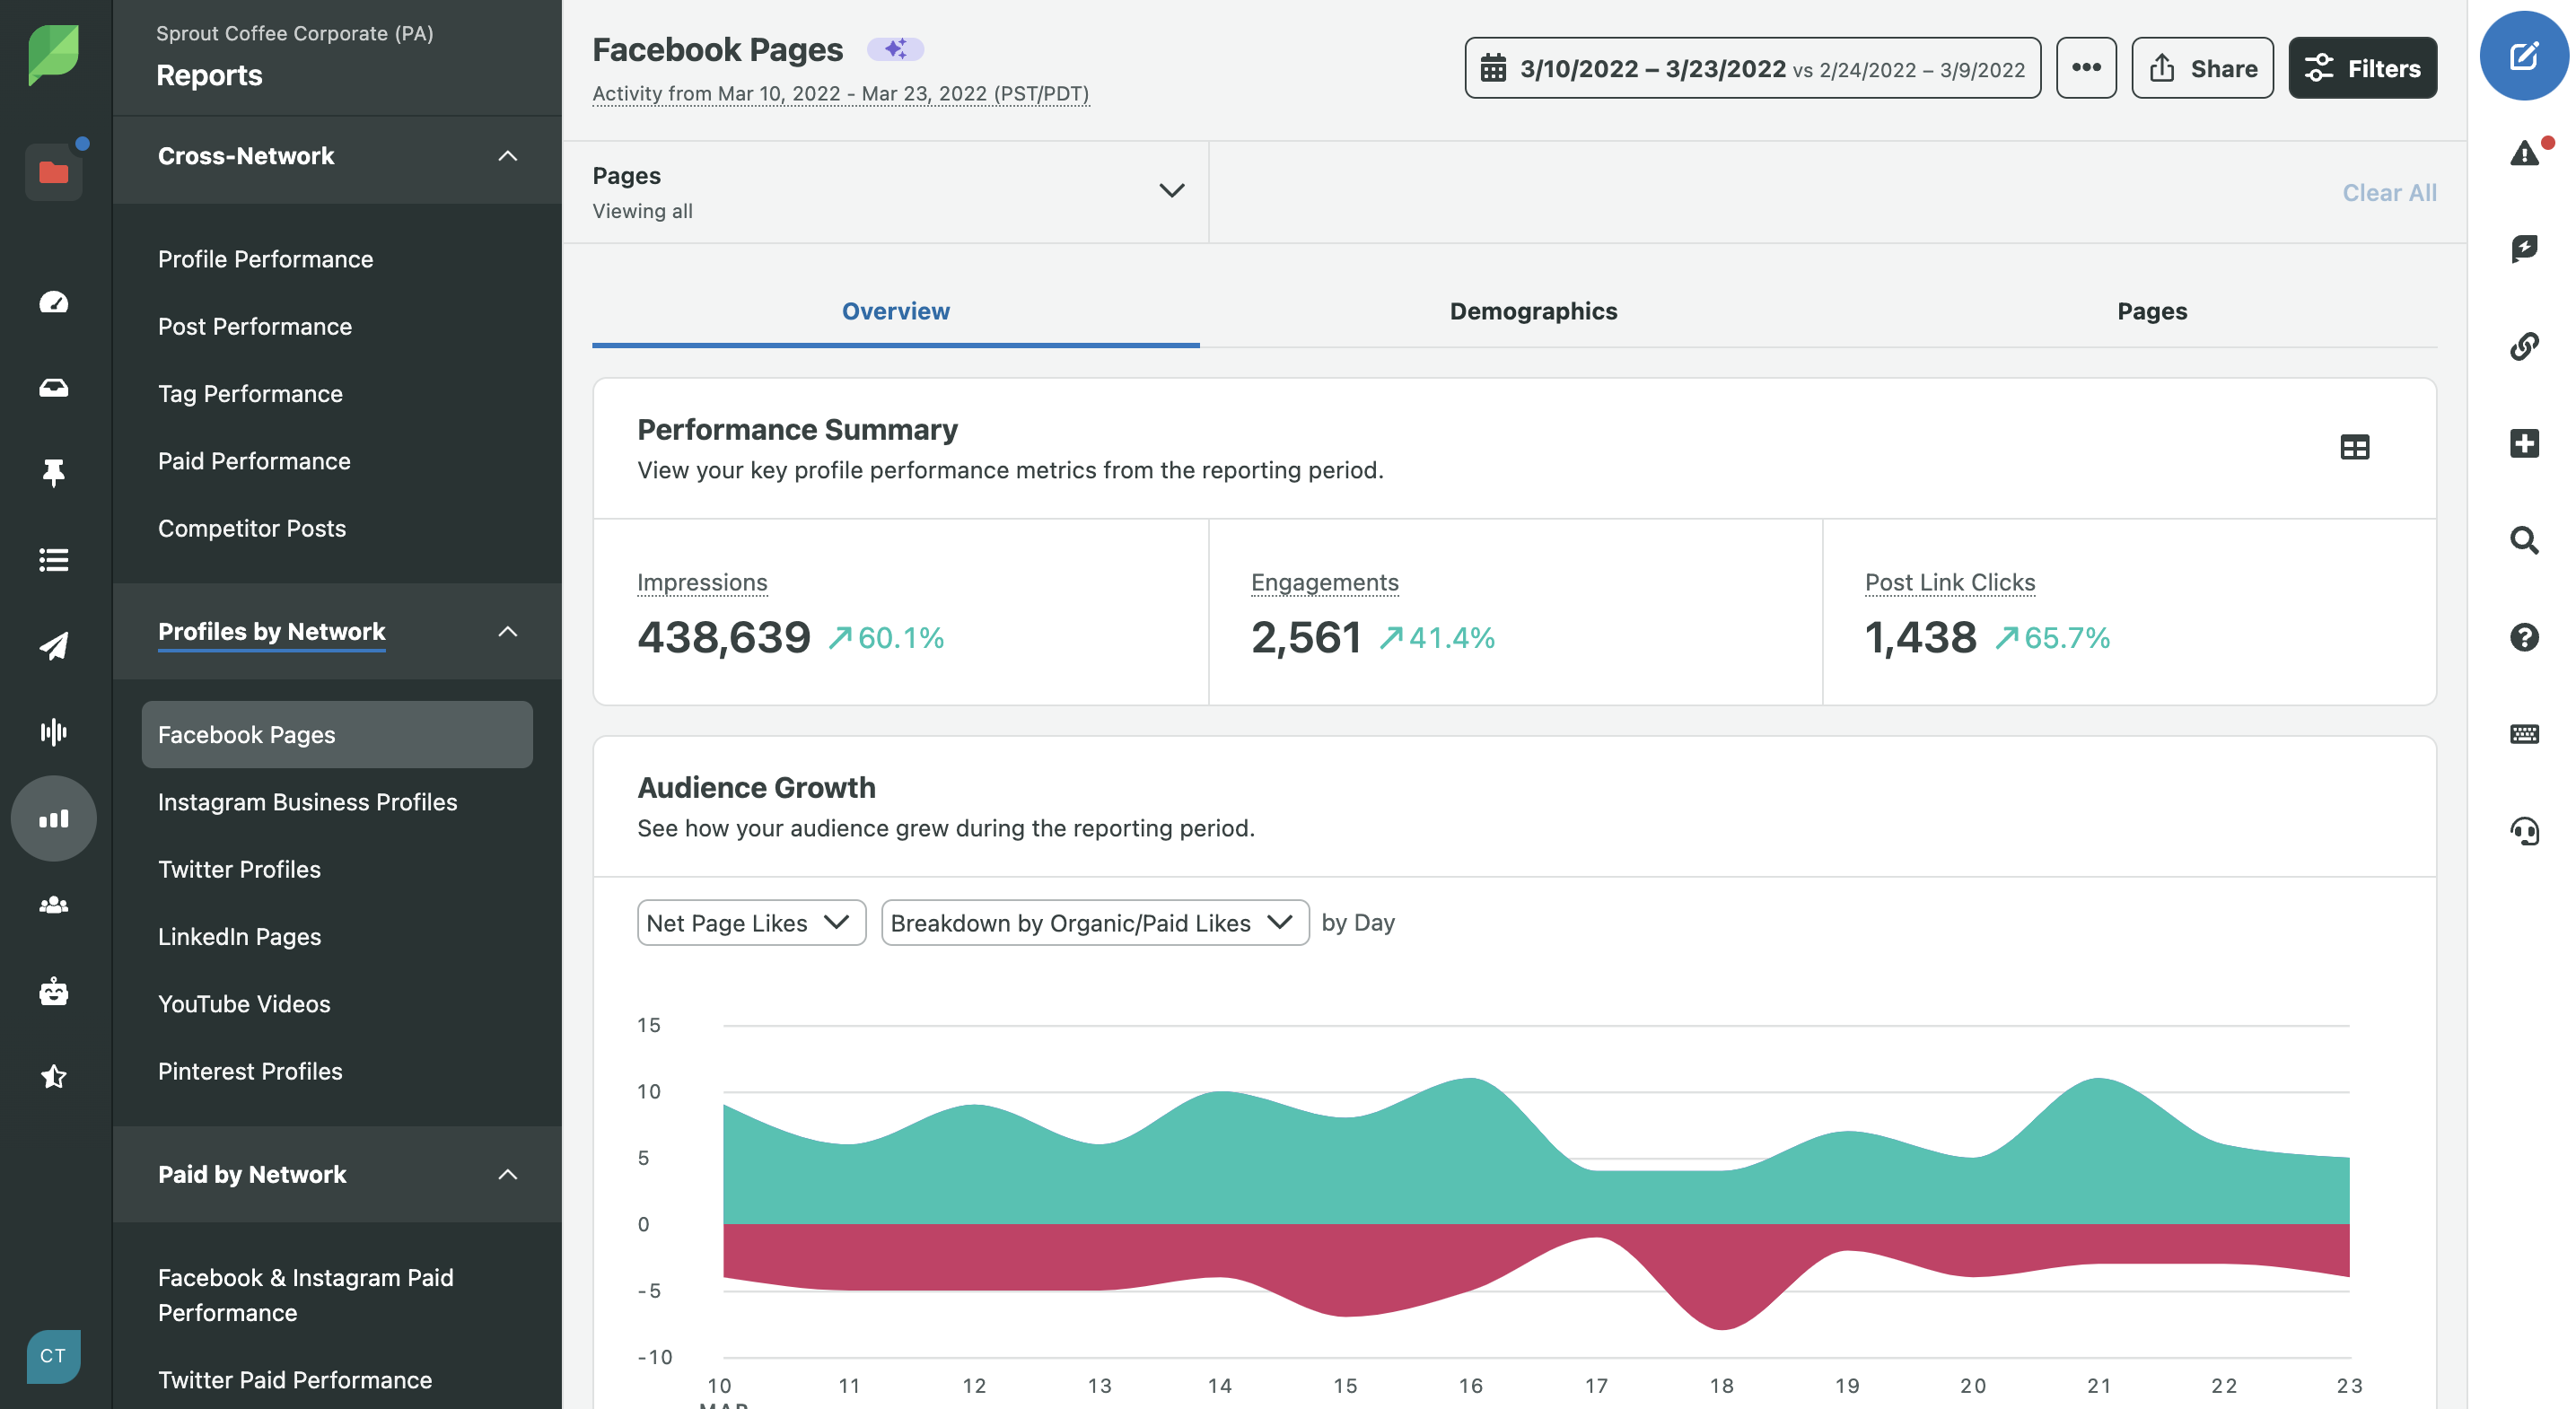
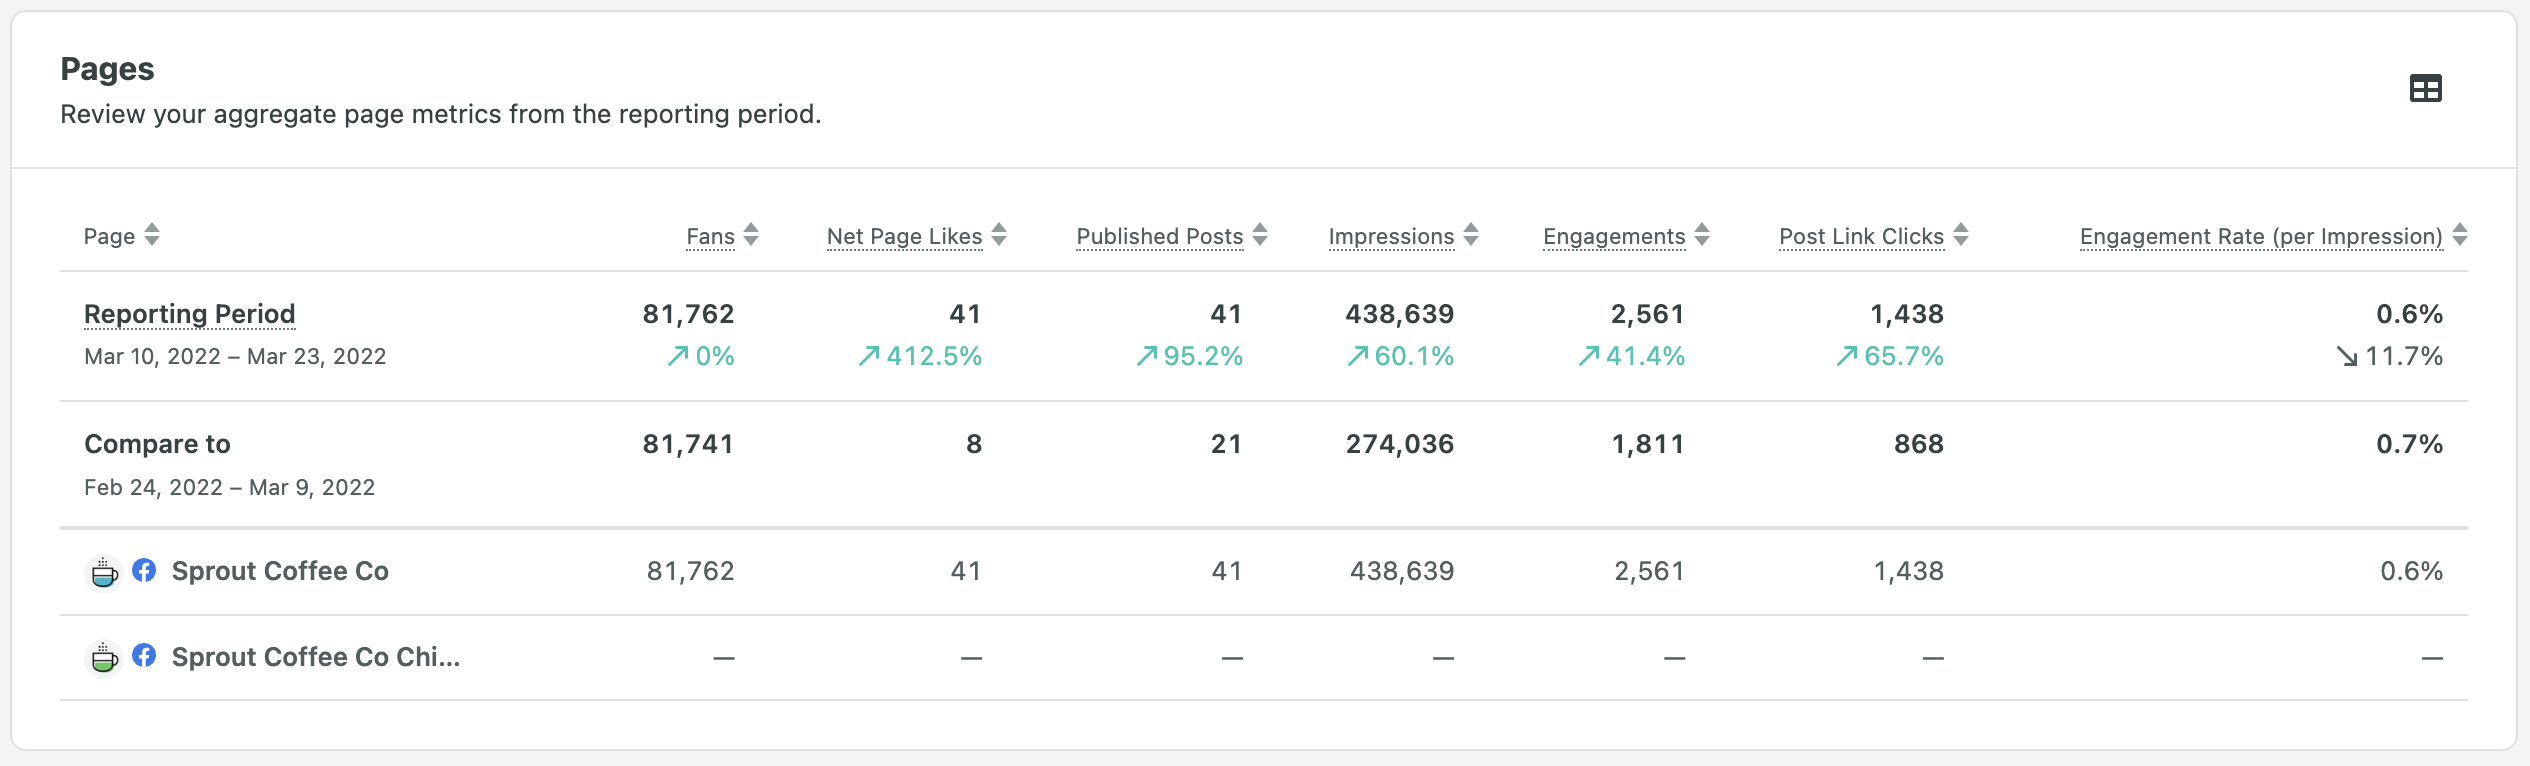
See how often you’ve been publishing Facebook posts with Sprout’s Facebook Pages Report. This report also shows you what type of content you’ve published, your three top-performing posts and engagement for each post. You can view impressions—both paid and organic—and see reactions, comments and shares for each post.
2. Gather Your Data
Now that you have some benchmarks and an idea of what your competition is doing, it’s time for some self-reflection. In this step, you’re going to pull data on your brand through Facebook Insights or Sprout Social.
Accessing Facebook Insights is simple: just go to the Facebook Page Manager and click Insights. The default data range displayed on Facebook Insights is 28 days, but you can toggle this to fit your needs.
If you’d like to download the data to analyze or manipulate it off the Facebook platform, click on the Overview tab, then on Export Data. There will be a popup showing three kinds of data types you can export: page data, post data and video data.
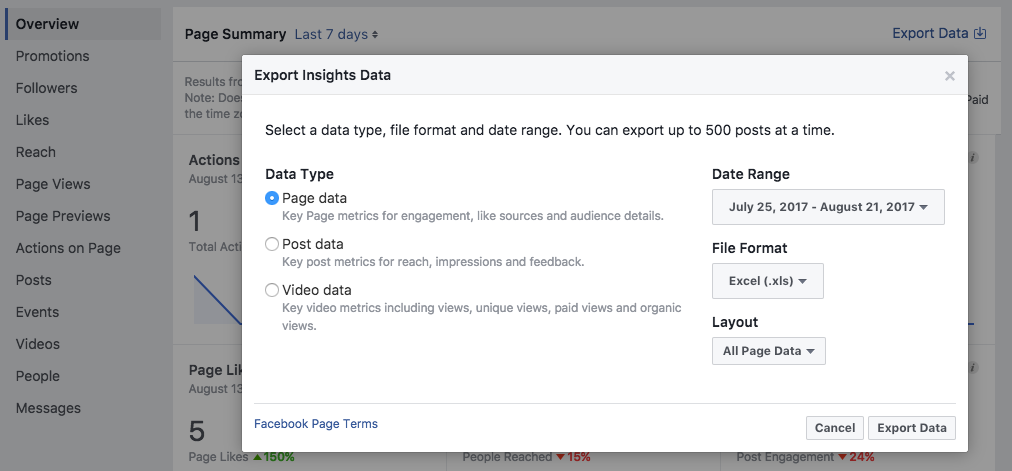
What does each export include?
- Page Data shows you key page metrics for engagement, like sources and audience details.
- Post Data provides metrics for post reach and impressions.
- Video Data displays your key video metrics like the number of views: unique, paid and organic.
In Sprout, after you sign up and connect your Facebook account, you’re going to access the Facebook Pages Report.
Once you have all the data in front of you, it’s time to dive deep into your Facebook analysis.
3. Analyze Your Facebook Page Data
Once you’ve gathered all your data, it’s time to dive into the numbers. It’s best to divide this into two different parts. First, we’ll take a look at page-level metrics, then we’ll go over analyzing individual post-performance.
Before trying to make sense of all this data, it’s helpful to set some key performance indicators (KPIs) that are important to your business. For example, if you’re using your Facebook Page to drive traffic to your website, one of your KPIs might relate to link clicks. However, if you’re focused on building a community, set a KPI for engagement stats.
If you’re using Sprout’s Facebook Pages Report, you’ll be able to surface your custom KPIs at the top of your report in a summary – that way, your attention stays focused on the most relevant metrics to your business.
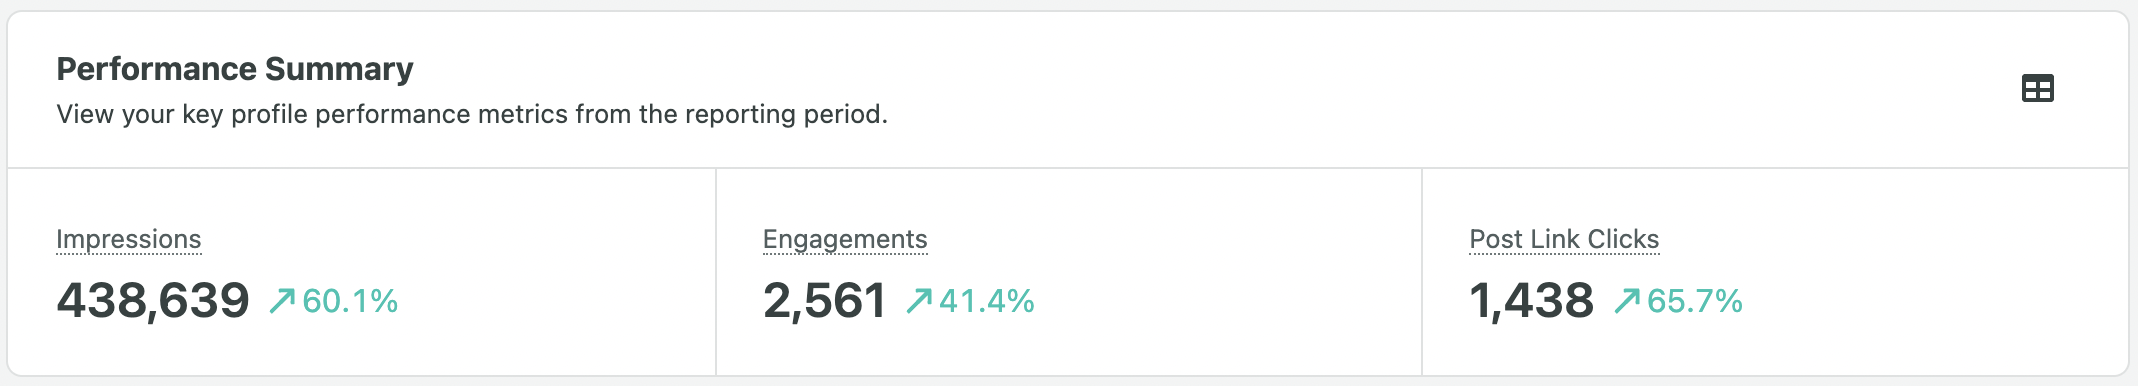
While there are a ton of metrics you can look at, we’ve trimmed the list down to some key metrics we feel indicate strong content and a successful social strategy.
Facebook Likes
This simply refers to the number of people who click the “Like” button on one of your posts. Facebook likes are a clear indicator that somebody is enjoying your social media content. This is a metric that you should always work on increasing, as it shows that people have some basic connection to the content that you’re posting.
The Lifetime Likes tab shows the overall likes for the page in the time period you’ve designated. You can use the data on this tab to identify specific days when likes spiked. Comparing this page data to post data, you’ll be able to identify specific posts that resulted in a good response from your audience, which may correlate to an increase in page likes.
Use the Daily New Likes vs. Daily New Unlikes tab to determine your net number of likes for the day, and to determine the days when you had the most unlikes. You can also cross-reference this with post data to identify which posts do not seem to be resonating with your audience.
Lastly, take a look at the Where Your Page Likes Happen tab to get information regarding from where people ‘liked’ your page. More than likely, no pun intended, a majority of people liked your page directly, but a number of fans could’ve come from other sources such as a Facebook button on your site. Knowing this is useful for connecting your digital marketing efforts across channels.
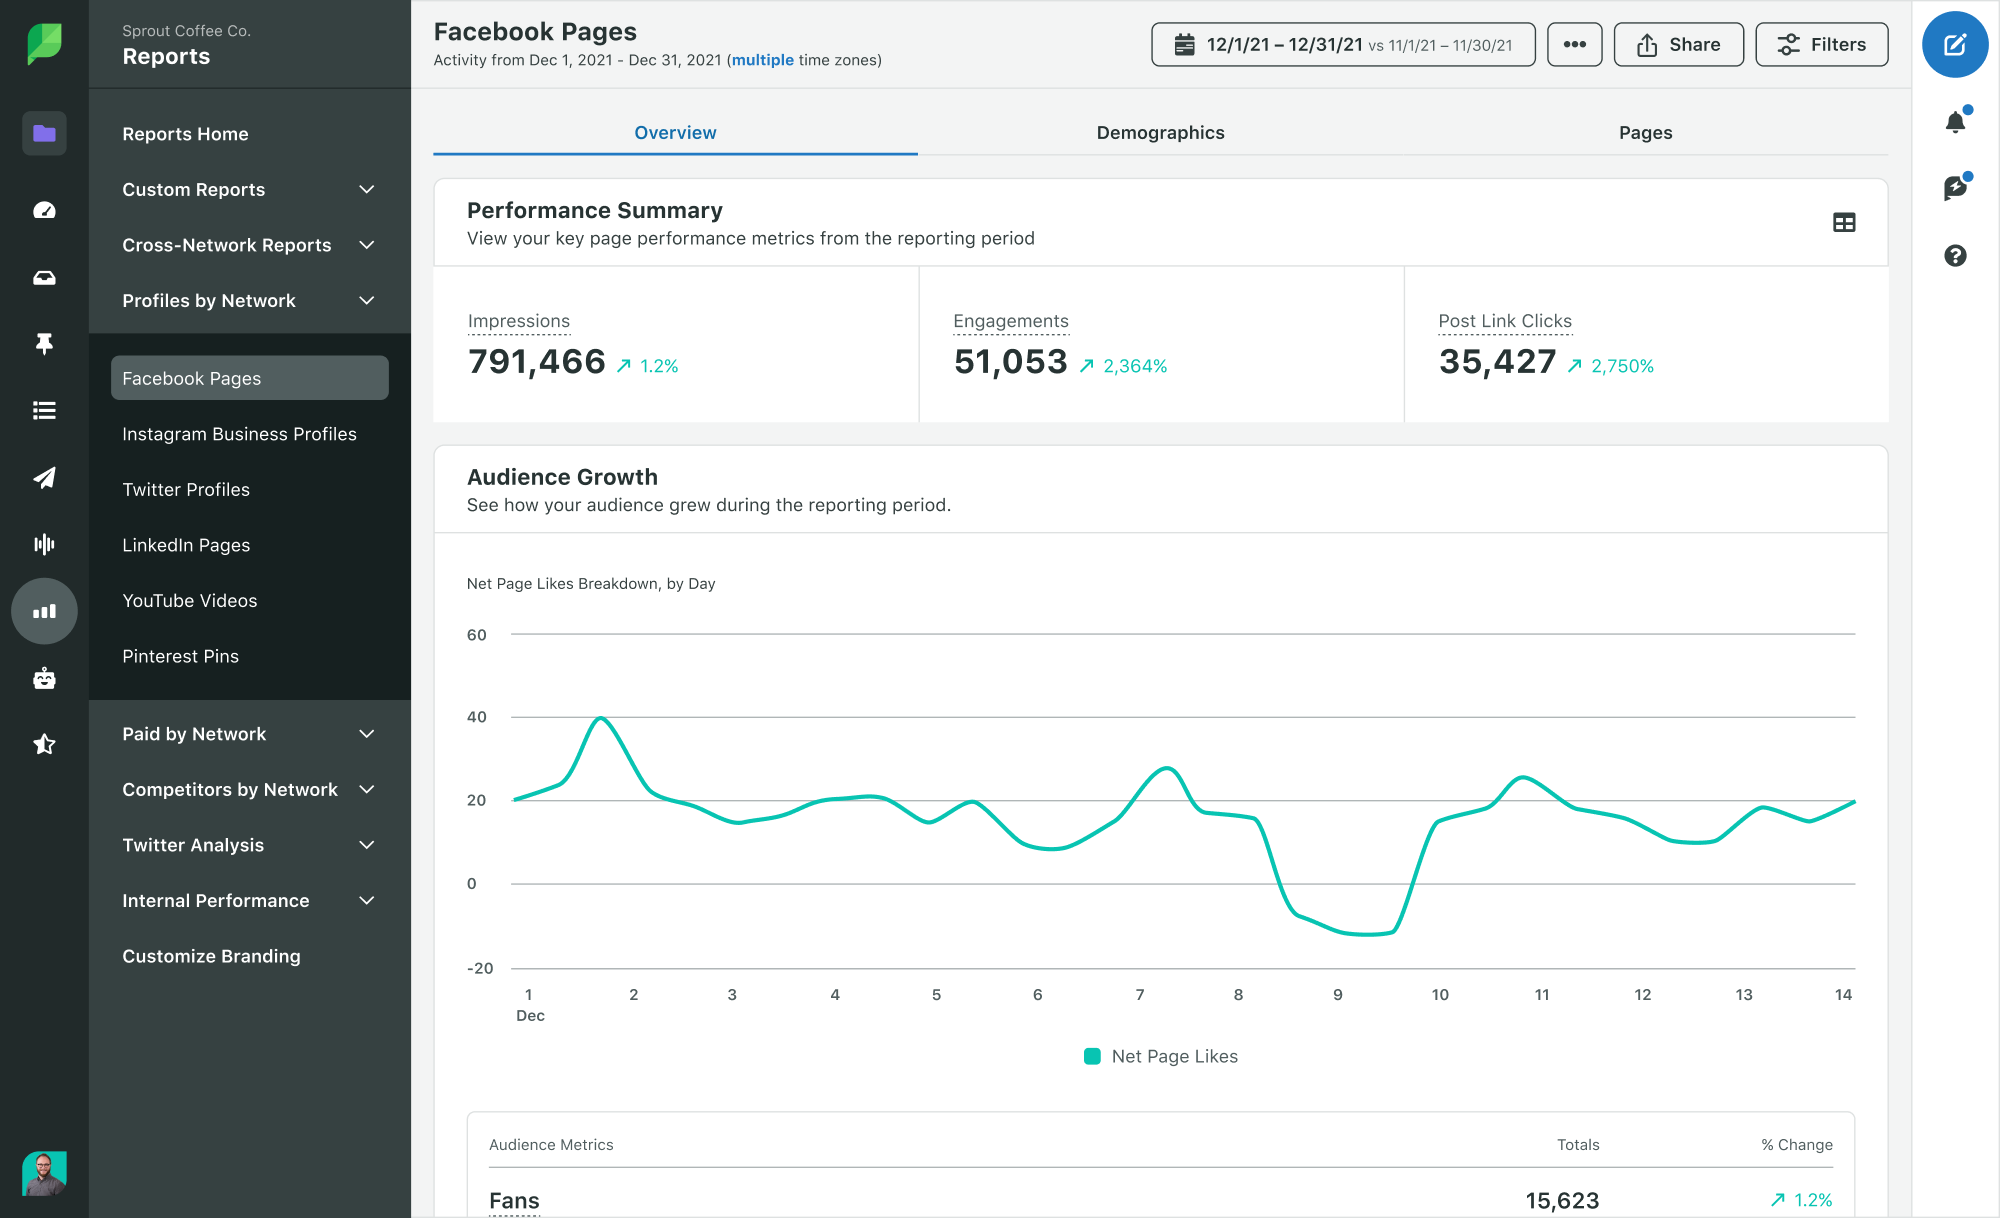
In Sprout, use the Audience Growth widget in the Facebook Pages Report to see how your number of likes and unlikes trend over time. This can help you compare organic vs. paid likes, evaluate likes by profile and against total fans. You’ll be able to select the metrics you’d like to view and see the breakdowns or comparisons by day.
Facebook page reach
Reach refers to the number of people who saw and/or interacted with your posts, and it includes negative interactions, such as hiding posts or reporting posts for offensive content.
Facebook page engagement
Engaged users refer to the number of people who clicked anywhere in your post, without generating a story, plus the number of unique people who created a story about your Page post. This is a great metric to increase because it means people are creating their own unique stories about your posts.
Video Stats
The page data also includes statistics about your video content and how users interact with it.
To access this data, check out the tab for Total Video views (daily, weekly, 28 days), for paid and organic views. There is also a tab with data for the Daily Total Number of Times a Video Has Been Seen Again, which is the number of times a video has been played after the initial play. More than one play per person indicates that people have been coming back to your page to see the video.
Another tab to consider in your Facebook analysis is the Daily 30-second Total Views, which shows the number of times a user has viewed a video for at least 30 seconds, with additional data regarding how many people have viewed the end of a video. Both of these metrics are useful in understanding whether or not your content was interesting enough to warrant more than a cursory glance.
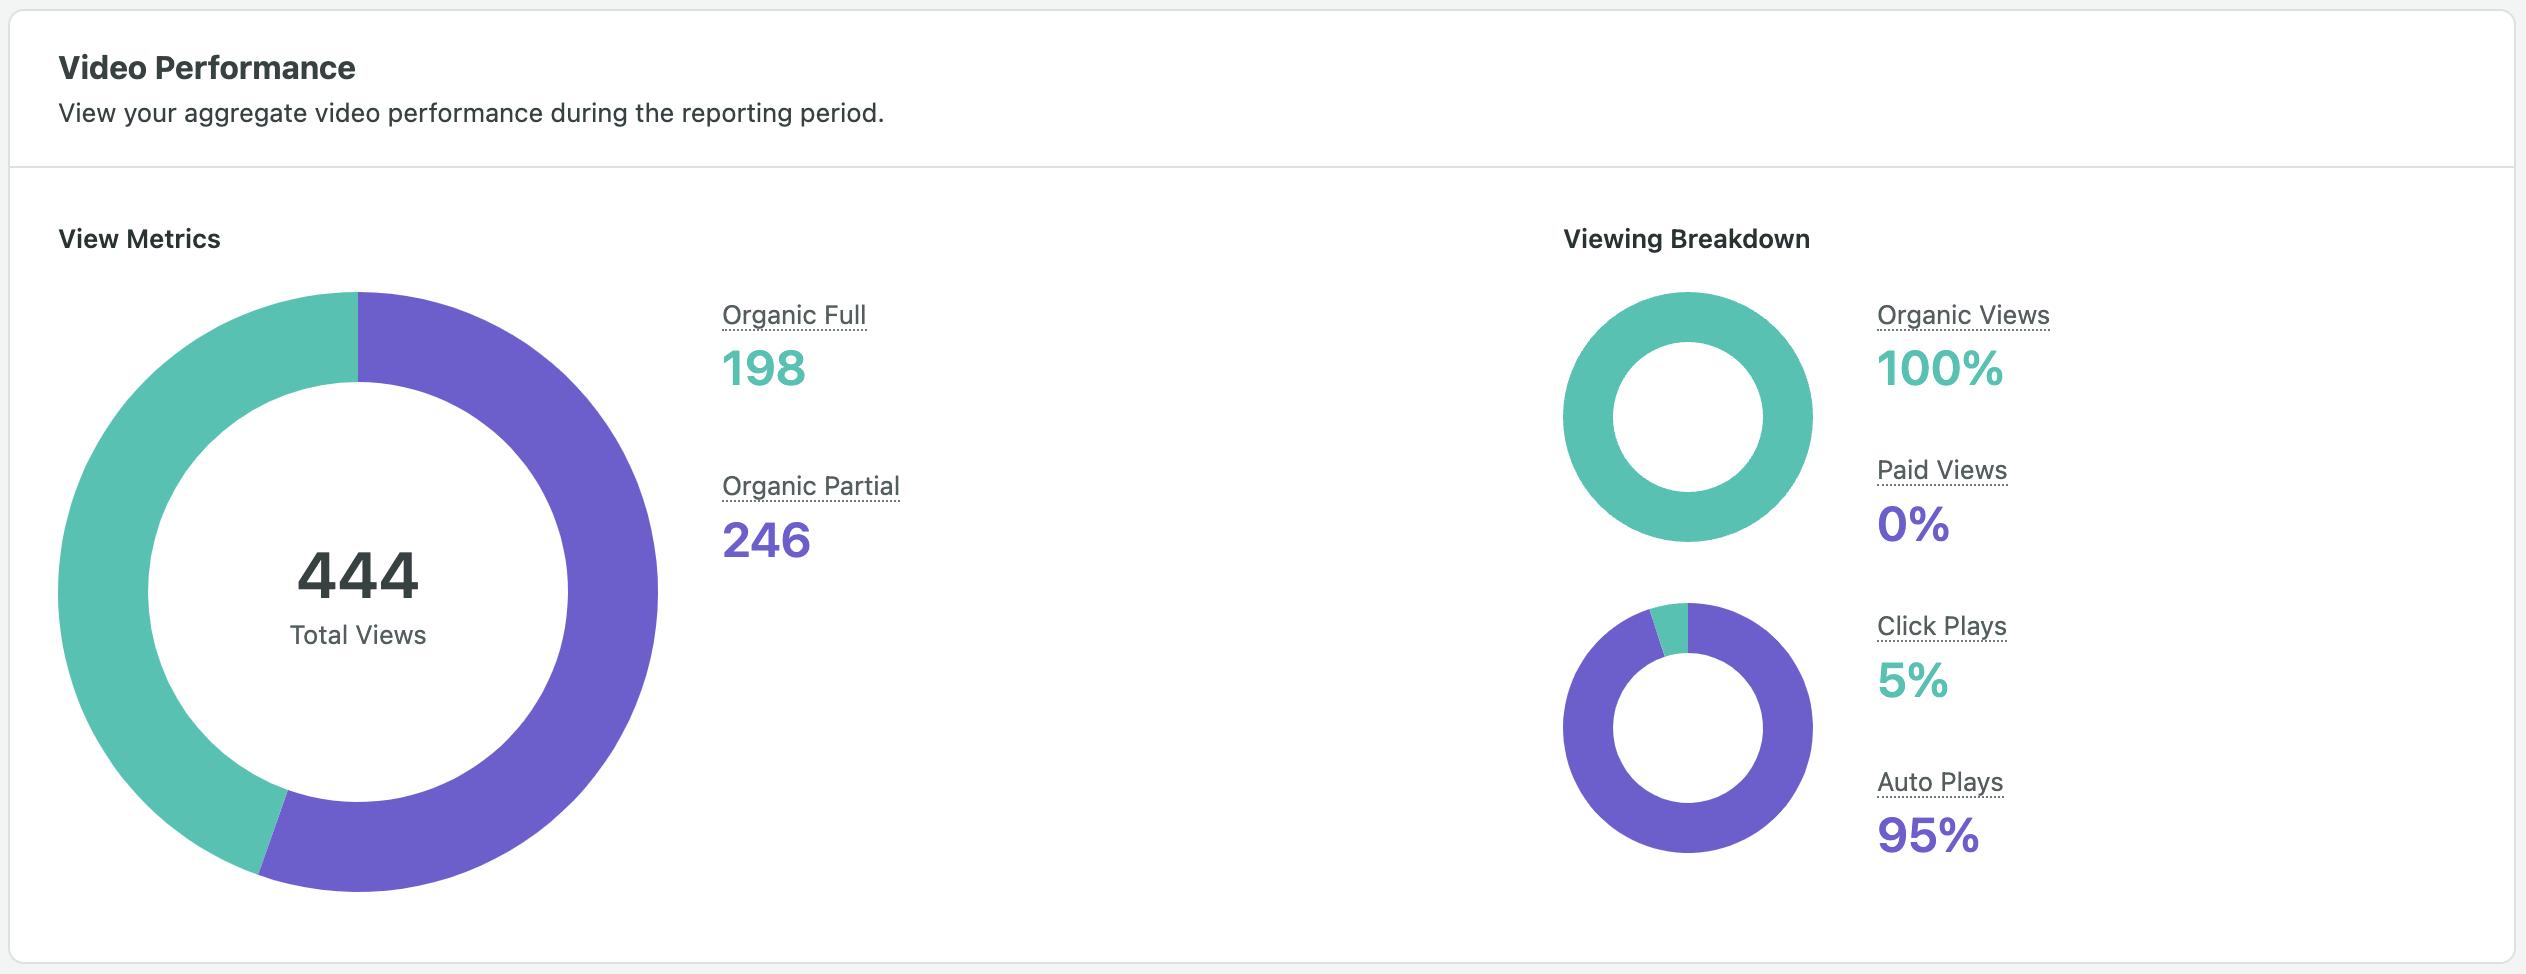
Your Sprout report has a dedicated section for video metrics and will give you additional video performance data, including video view times, paid vs. organic video view times, partial video view times, average video time watched and more.
Bot stats
If you’re using chatbots to interact with Facebook users, you’ll need to track their performance. With Sprout’s Facebook Bots Report, you can see the number of messages exchanged between users and chatbots, the number of unique chatbot interactions, and the most common quick replies.
4. Analyze Your Facebook Posts
When looking at the performance of individual posts, we’re going to analyze both reach and engagement metrics. Here’s a breakdown of what each includes:
- Post Reach shares basic post statistics like impressions, engaged users, consumption and video views.
- Post Engagement shares basic engagement stats like engaged users, consumption and negative feedback.
Reach
According to Facebook, “Post reach is the number of (unique) people who have seen your post. Your post counts as reaching someone when it’s shown in their News Feed.”
The number of impressions is similar to reach but instead refers to the total views of the post. Of course, both metrics are important to focus on increasing, as the more people you reach, the more potential customers there are seeing your posts.
The algorithm that Facebook uses to decide what to show in each user’s News Feed is known as “Edgerank”, and it’s made up of a handful of different factors. To keep things simple for this topic of Facebook analysis, assume that your posts will gain more reach with an increase in clicks, shares, comments and likes.
Look at the post reach and identify spikes and peaks in the Reach column. You can also see the type of posts contributing to these likes along with their permalinks (if you want to refer back to the published post).
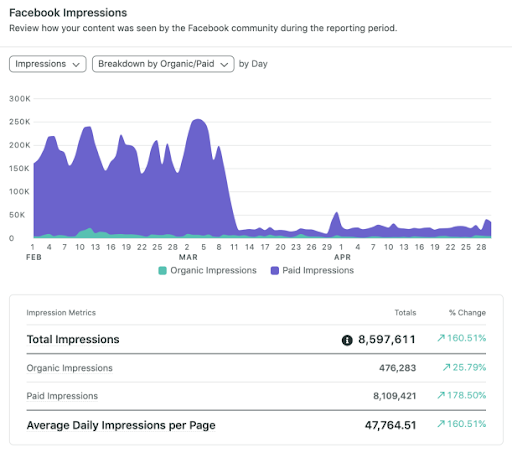
You can use the Facebook Impressions widget in the Facebook Pages Report to see patterns in organic, paid, viral impressions and the number of people your content has reached. Break down the data to compare organic vs. paid content impressions and reach and measure the average by profile.
Comments, Likes & Shares
There are three primary ways people engage with your posts:
- Comment
- Likes or Reactions
- Share
Analyzing these metrics will help you determine which posts resonated best with your audience. Once you know which posts worked, take what you can from them to duplicate this success.
Shares
More so than liking or commenting, someone sharing one of your Facebook posts is a strong indicator that your post really resonated with them. After all, they wouldn’t pass it on with their stamp of approval to their friends and followers unless it really struck a chord. When it comes to sharing, users have the ability to:
- Share on their own Timeline
- Share on a friend’s Timeline
- Share on a Page they manage
- Share in a private message
- Share in a group
No matter how fans share your content, this action fuels the Edgerank score for that piece of content and, in turn, increases that post’s reach.
Looking at the posts with the highest shares will help identify the posts people share the most. It also lets you continue crafting content that people will be compelled to share.
Comments
Comments allow you to get direct feedback on your content from your audience. Not all comments are good, and negative comments may be an indicator that you should stop and rethink the content you’re publishing.
Positive comments and engagement indicate that your content is resonating with your audience. Regardless of the connotation, more comments mean more fuel for the Edgerank algorithm. Just don’t be tempted to post content, especially if you know it’s a bit edgy, without carefully monitoring what happens next, and intervening if necessary to deal with negative sentiments.
Link and Post Clicks
As your content starts to draw engagement, it will naturally start to result in more reach. As long as your click-through rates remain constant, you’ll see an increase in the overall clicks on your posts or clicks to your website.
In the Lifetime Post Consumers by Type tab, you can see these stats that make up Facebook’s Consumption metric: Clicks to Play, Link Clicks, Other Clicks (likes, comments or shares that generate stories) and Photo Views. These are posts where people have shown willingness to take action.
For a quick view of which posts receive the most clicks, use the Facebook Top Posts widgets and select Post clicks from the metrics dropdown. You’ll see the top 3 posts by clicks, but you can also manipulate those metrics to see the top posts by engagement, reaction, shares or even video views. Define what makes a post successful for you and filter by that metric.
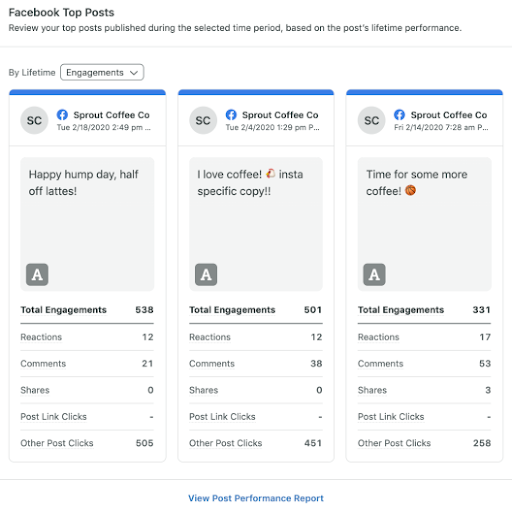
5. Ask Yourself the Right Questions
Now that you have some insights as to how to properly interpret data, use these questions to help guide your Facebook analysis.
What Kind of Messaging Resonates?
A major reason to conduct a Facebook analysis is to find out which of your content performs the best. Then use that knowledge to guide your copywriting strategy.
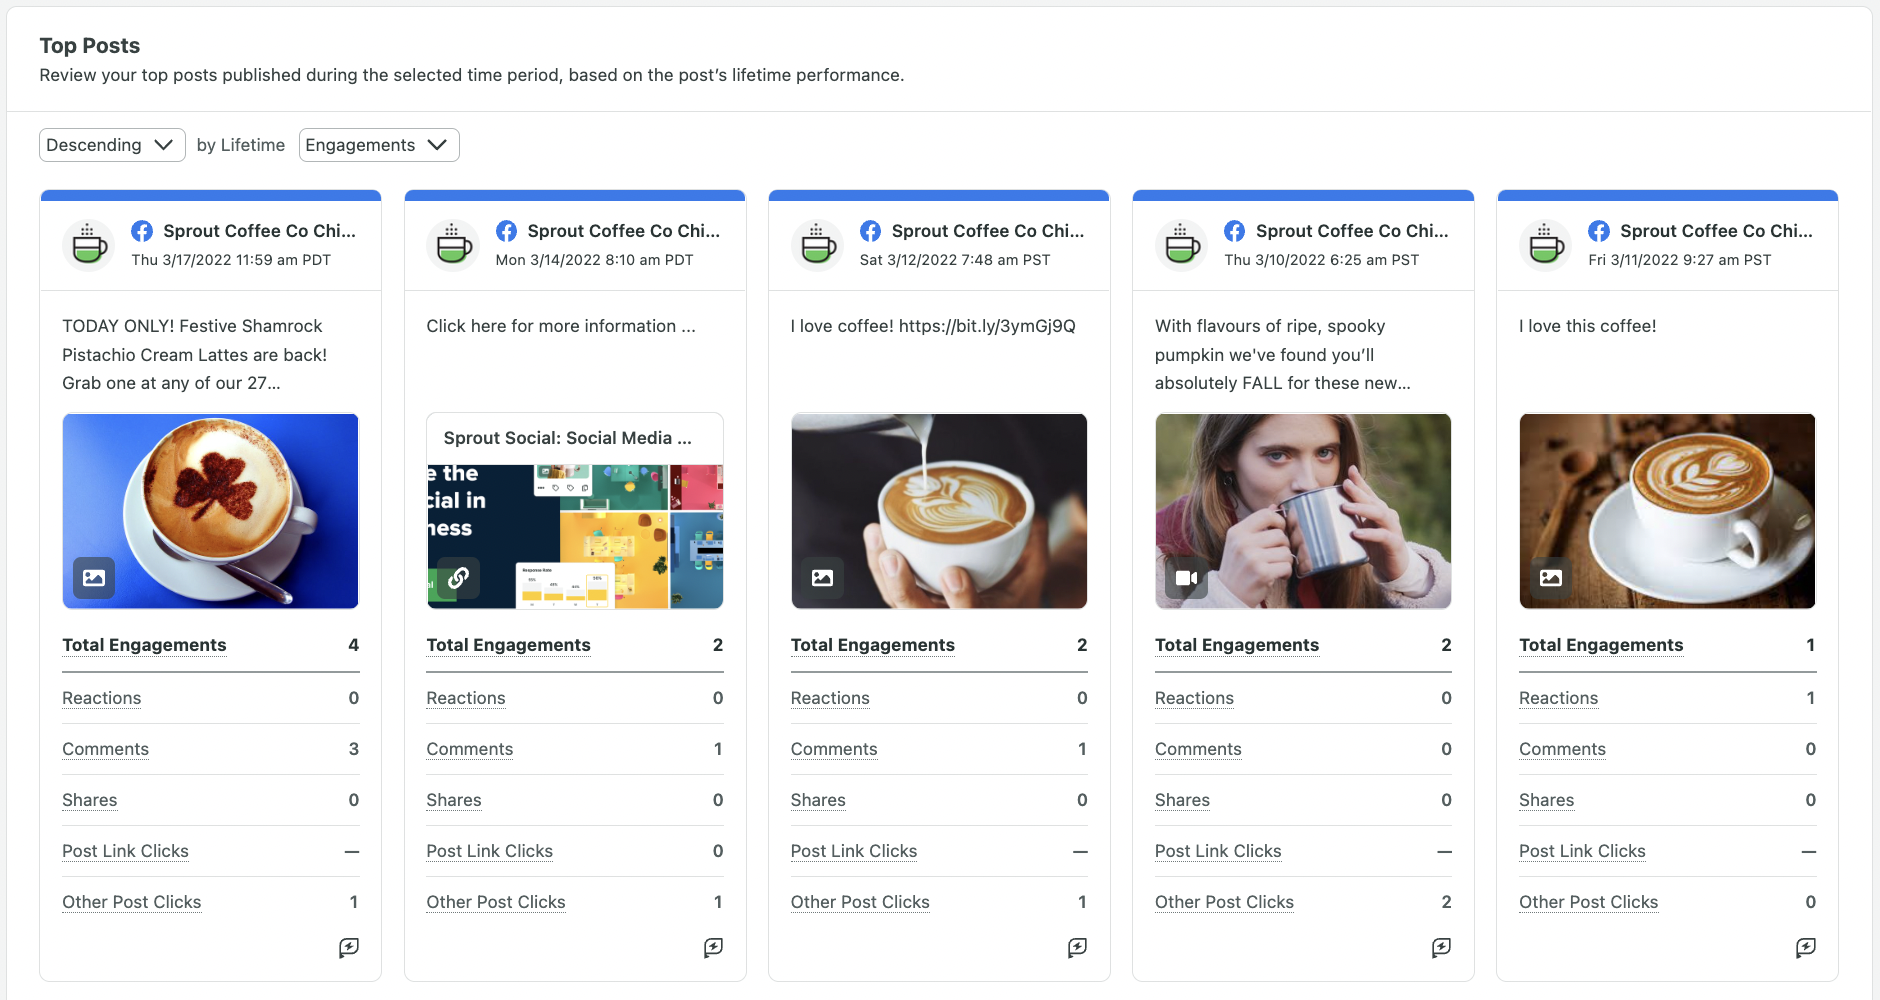
Just below the Facebook Top Posts widget, you’ll see a link to the Post Performance Report. This is a dedicated report that will help you understand how each individual post you’ve created has performed.
Choose from 90+ metrics to add to your report to make sure it’s personalized to your success indicators. You can get as granular as “non-viral impressions” or “wow reactions”. Then, click your key performance metric at the top to sort by the top performing pieces of content. Study these posts to see what they all have in common.
What Type of Posts Get Shared Most?
Facebook posts are typically broken down into four categories. Additionally, your engagement rate will vary depending on which type your audience prefers.
- Text or statuses
- Photos
- Links
- Videos
- Reels
- Instagram Stories
You can use the Publishing Behavior widget in the Facebook Pages Report to see a breakdown of the post types you’ve shared.
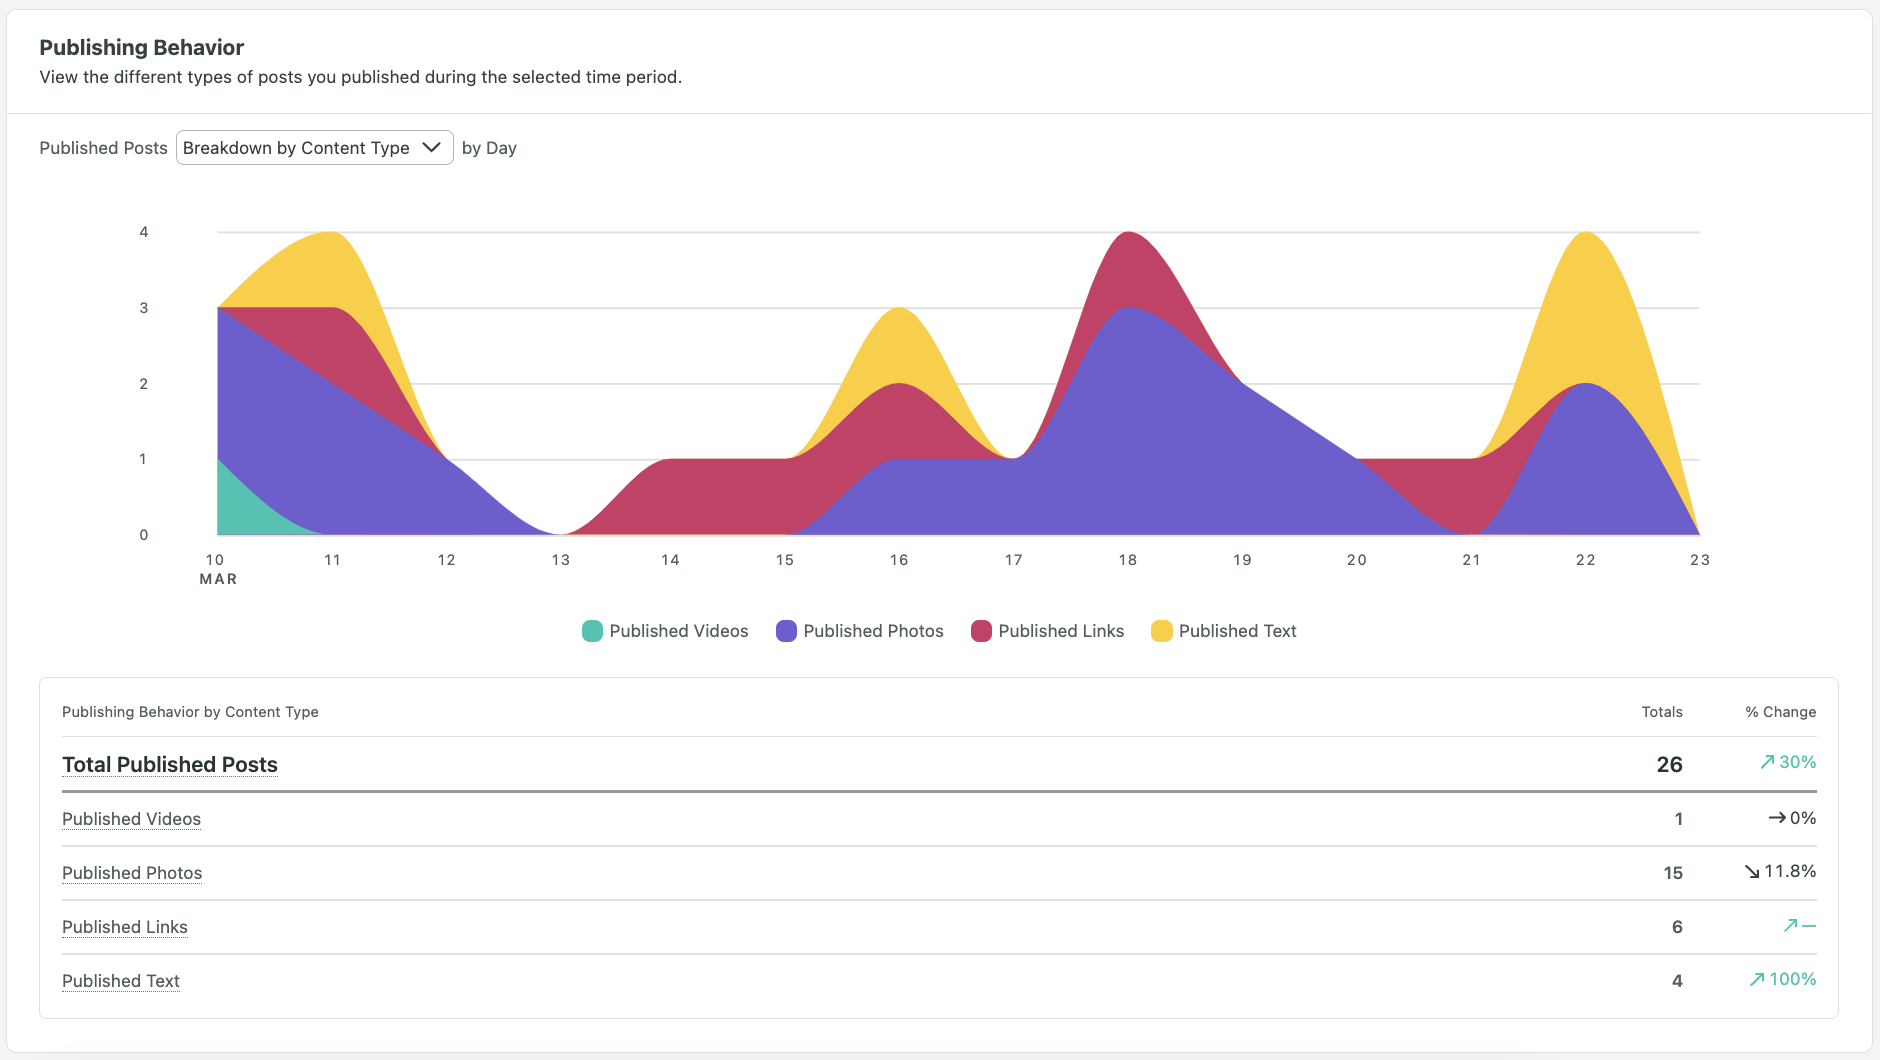
Although it’s important for you to take advantage of each post type, you should also favor the style that your audience engages with.
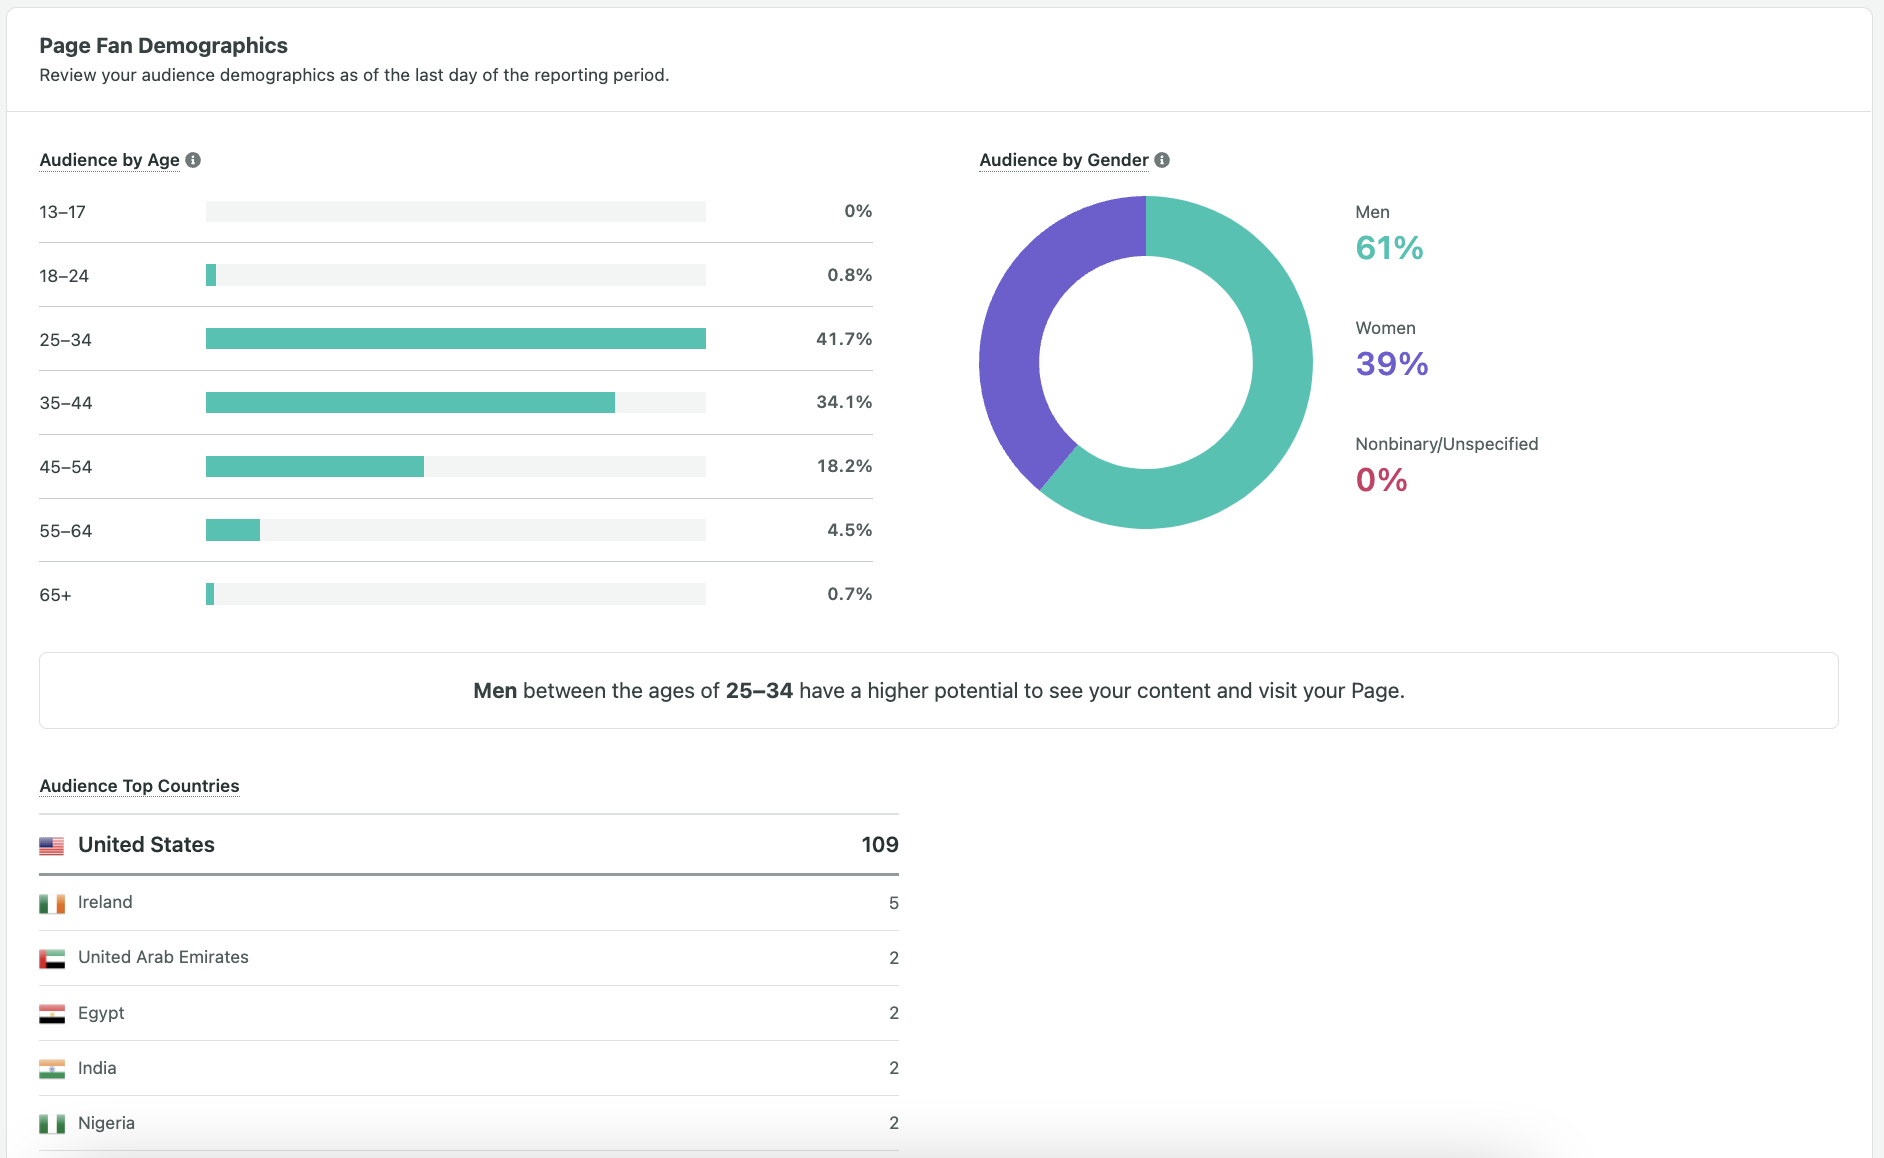
Who Are Your Facebook Users?
Understanding the demographic breakdown of your Facebook audience is a powerful insight that could help inform which types of products or content you post about and how you position them.
Locate the Facebook Audience Demographics tab in your report and look at the age and gender breakdown.
Pro Tip: Couple your personal demographic information with all social network demographic information to see if there are more networks where you could benefit.
Where Are Your Facebook Users?
As companies and social media sites go global, the idea of geo-targeting has become very popular. Distributing different content to Facebook audience members in different locations is something that great Facebook marketers should always be considering.
In the same Demographics tab that you found your demographic information, scroll down to see where your audience is located and the average # of people reached in each country.
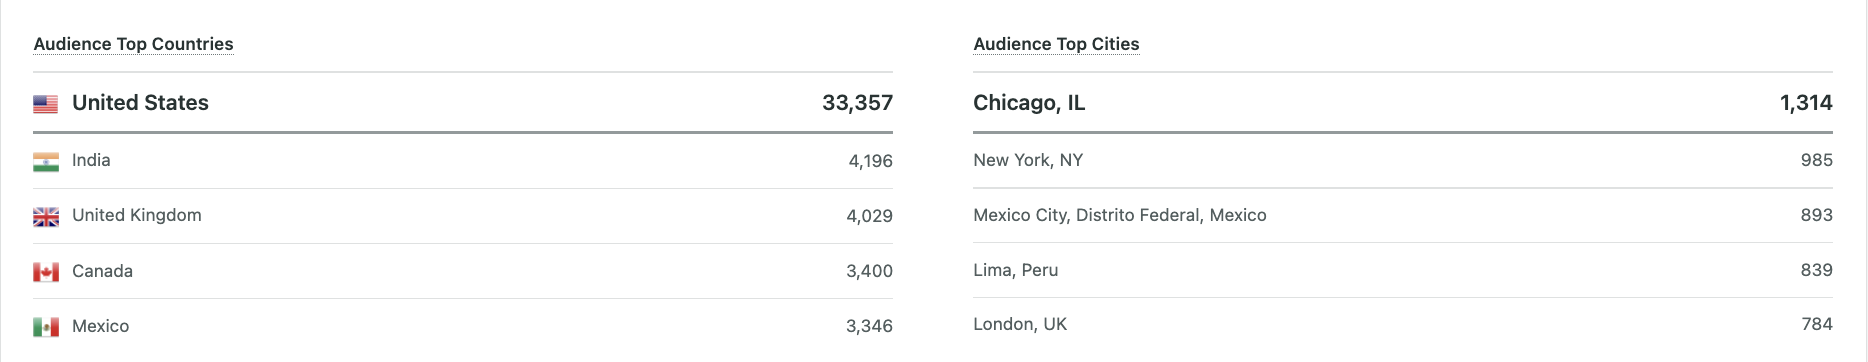
Figure out where your customers are located and target those locations with relevant content. You could also try to target the locations that you don’t see in order to build more brand awareness in areas that lack it.
When Should You Post to Facebook?
Most social media marketers are fascinated with finding the best day for them to post to Facebook. There are several studies and recommendations of the best time to post on Facebook. Our own research showed that afternoons tend to generate the most engagement. However, it’s very much dependent on your business and audience.
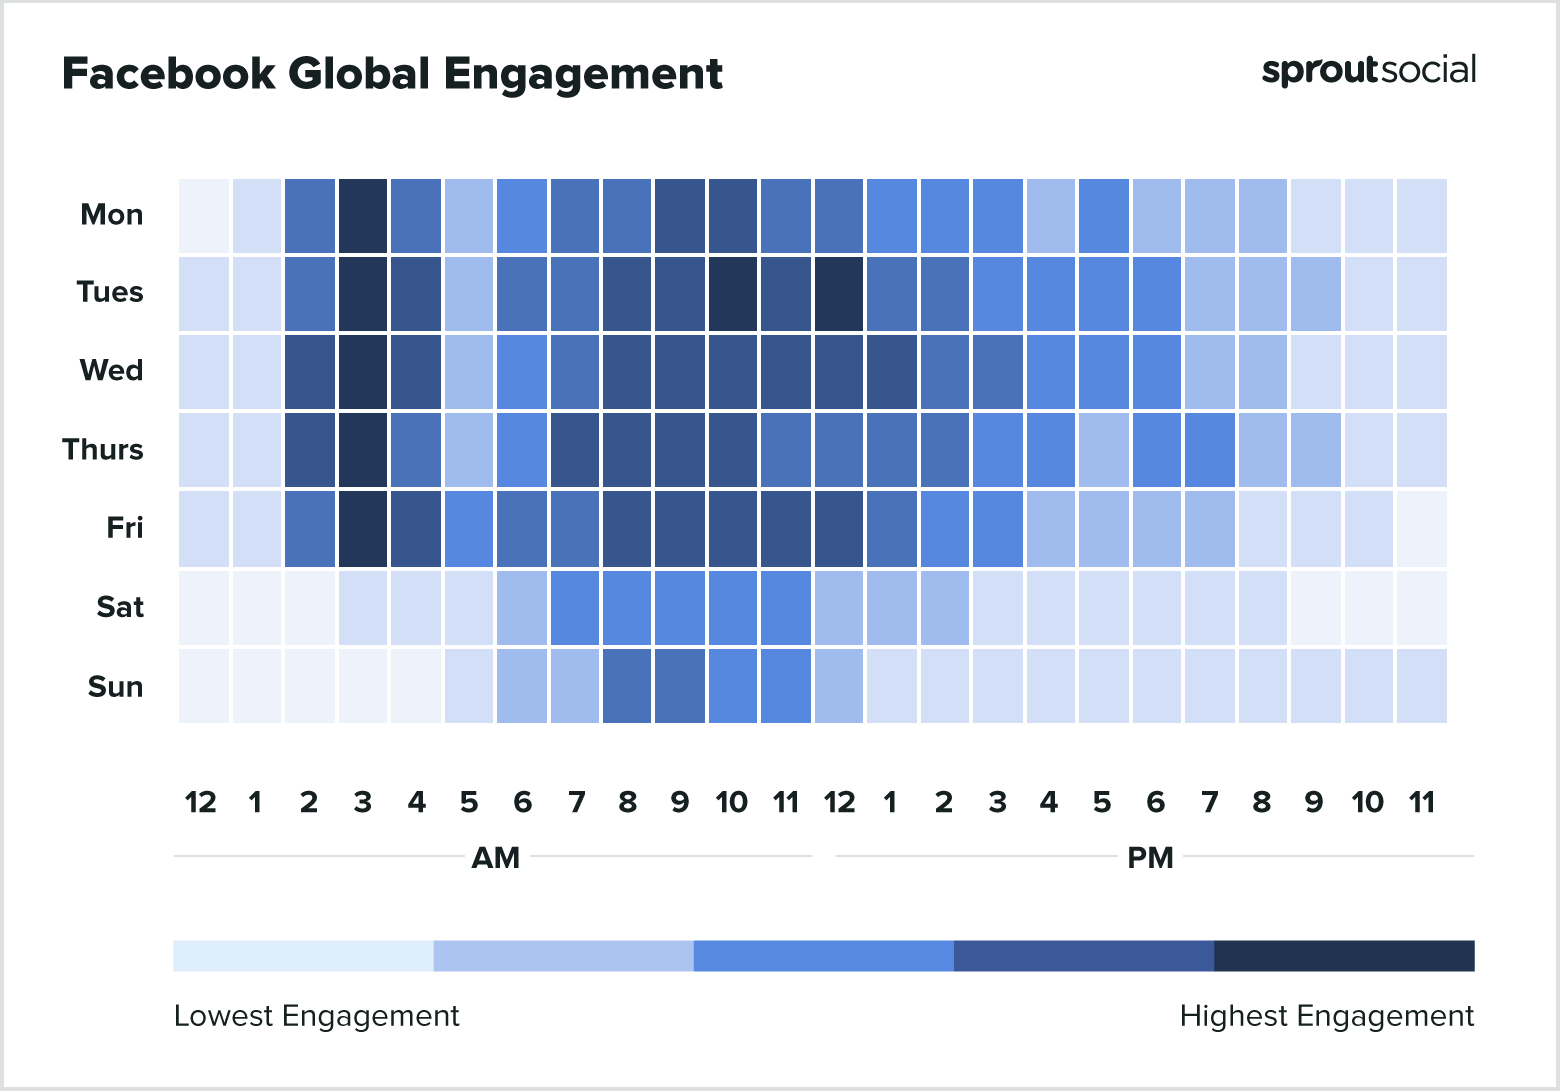
In order to figure this out definitively, analyze your Facebook Publishing Behavior report in Sprout. If you have a limited amount of content or don’t like posting every day of the week, use this information to pick and choose the best days to get your audience to share your posts.
6. What to Do After Checking Page & Post Data
Every social media presence is different, so what works for one company may not work for another. Besides, it would be very easy for potential customers to pick up on copycat behavior and get turned off by it.
Using the insights from your Facebook analysis, you can determine what types of content to publish and when. And with Sprout, you can schedule posts in advance, and get immediate analytics that show you how your posts are performing.
Conduct Your Brand’s Facebook Analysis
Facebook provides you with a wealth of information that upon first glance can be a bit overwhelming to sort out. With one of the Facebook Analytics alternatives we mentioned in this article, you can find the most pertinent data for improving your Facebook presence and advancing specific business goals.
A focus on key statistics while benchmarking against your competitors (and even your own past efforts) will help you to find continued success on the platform.
If you want to dive deeper into Facebook analytics consider doing a Facebook audit that will take you less than 30 minutes to complete.
The post 6 Steps to Conduct Deep Facebook Analysis appeared first on Sprout Social.