
Building a strong YouTube channel starts with understanding your audience.
Are you creating videos that your audience loves? Is your channel attracting tons of viewers? Where are those viewers coming from? There are plenty of questions you may be asking when you’re trying to build your YouTube presence.
And one of the best places to get answers to these questions is through YouTube analytics.
The YouTube analytics tool offers heaps of data that can tell you everything you need to know about your channel and content performance. That said, it can also get a little overwhelming if you’re new to it.
Check out this complete guide to find out how to navigate YouTube analytics and use it to your advantage.
- Why you should use YouTube analytics
- How to use YouTube analytics
- YouTube analytics general reports
- YouTube analytics watch time and audience reports
- YouTube analytics engagement reports
- YouTube analytics earnings reports
- YouTube analytics for competing channels
- YouTube analytics tools to level up your strategy
Why measuring your YouTube analytics is so important
We need to start by driving home just how important your analytics are.
YouTube’s algorithm is unpredictable and competition on the platform is absolutely fierce.
Anything you can do to optimize your channel performance is a plus. Through your YouTube analytics, you can zero in on:
- Top-performing videos in terms of views, watch time and audience and engagement
- Content themes relevant to your target audience (think: how-tos, tutorials, vlogs, webinars)
- How video details like thumbnails, titles and video length impact your video performance
In short, YouTube analytics can provide a detailed roadmap to guide your video marketing strategy.
How to use YouTube analytics
Before getting into the nitty-gritty, let’s start with the process of accessing your YouTube analytics. You can access it through the YouTube Studio page on your desktop browser or using the mobile app.
How to access YouTube analytics on desktop
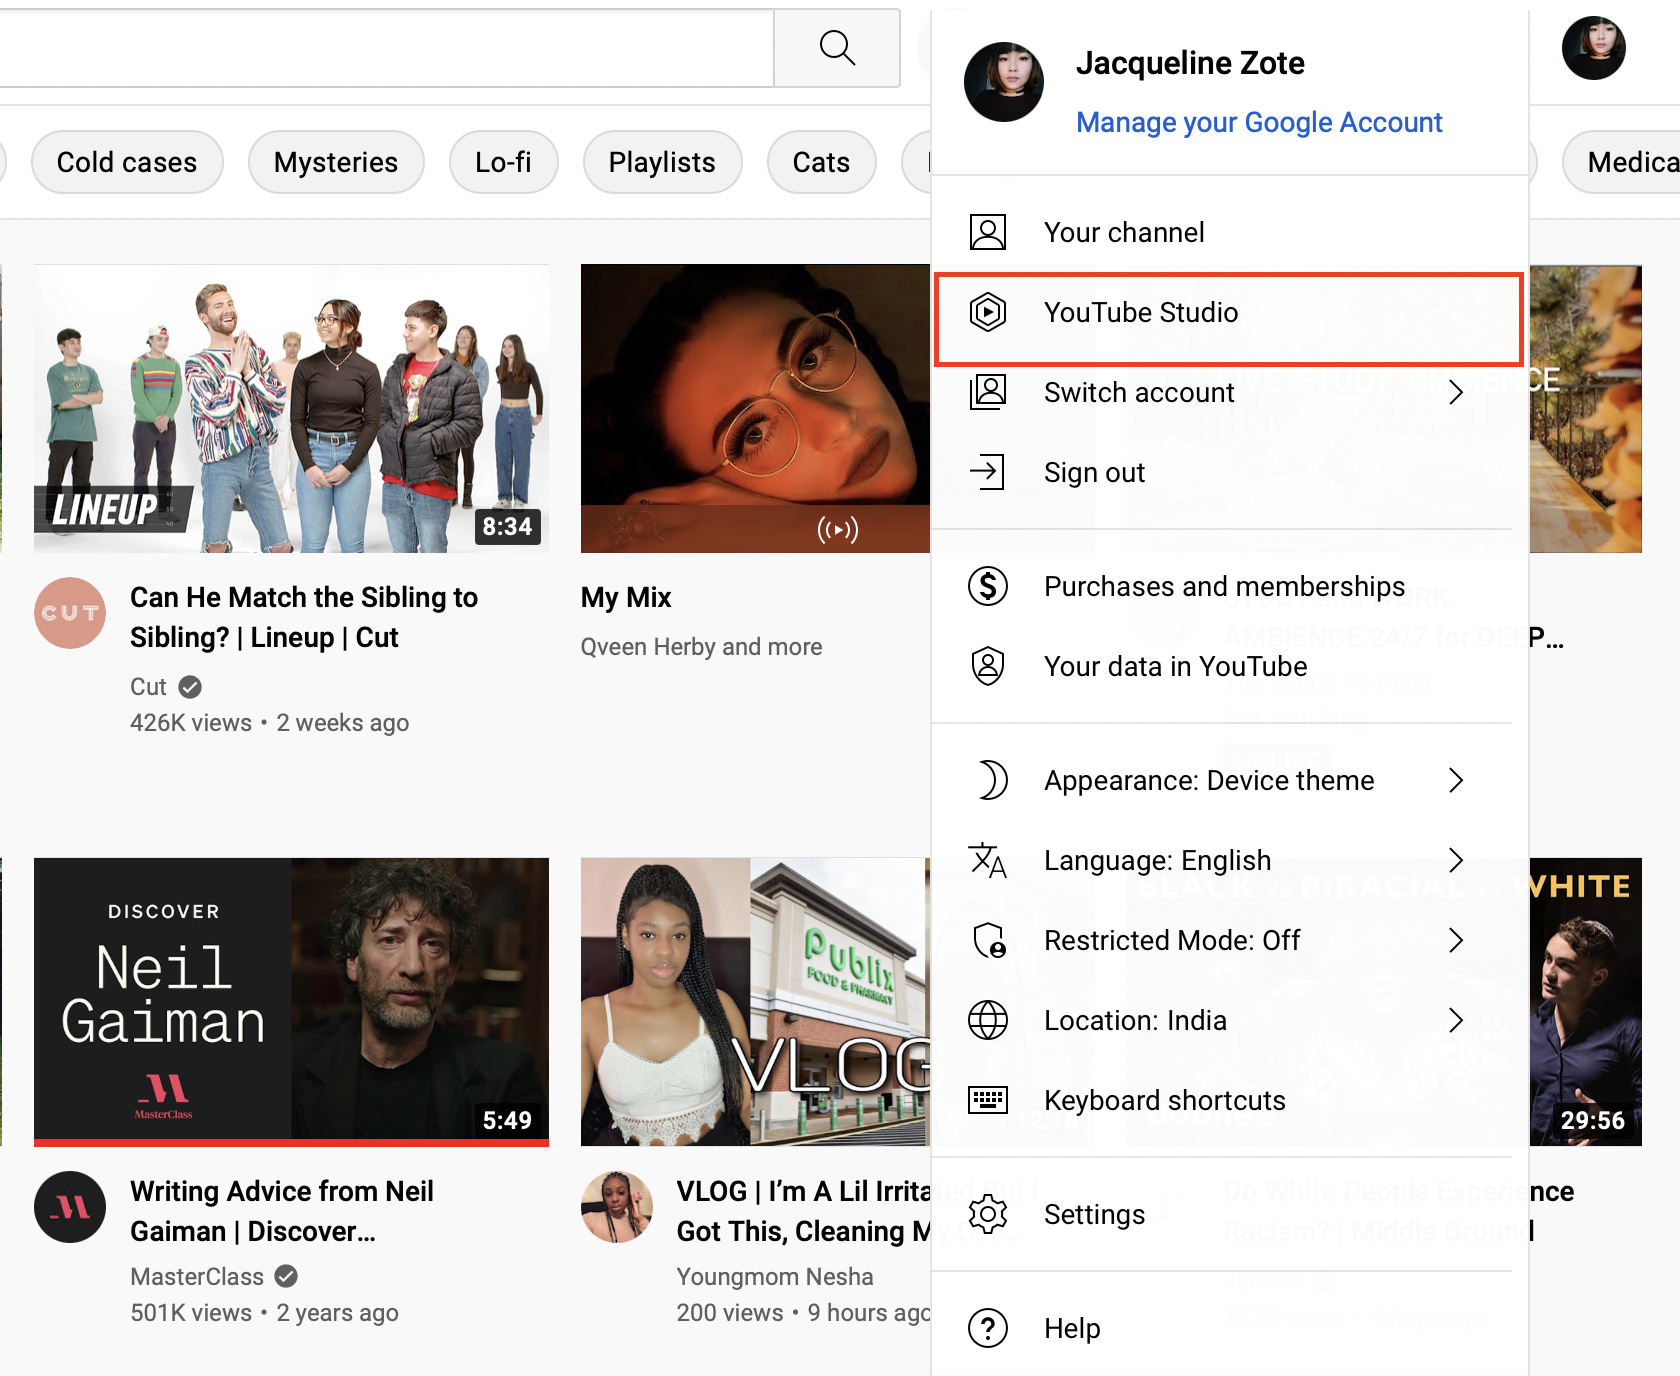
To access the YouTube analytics tool, you can log in directly from studio.youtube.com. You can also click on your profile icon from your YouTube account and select “YouTube Studio.”
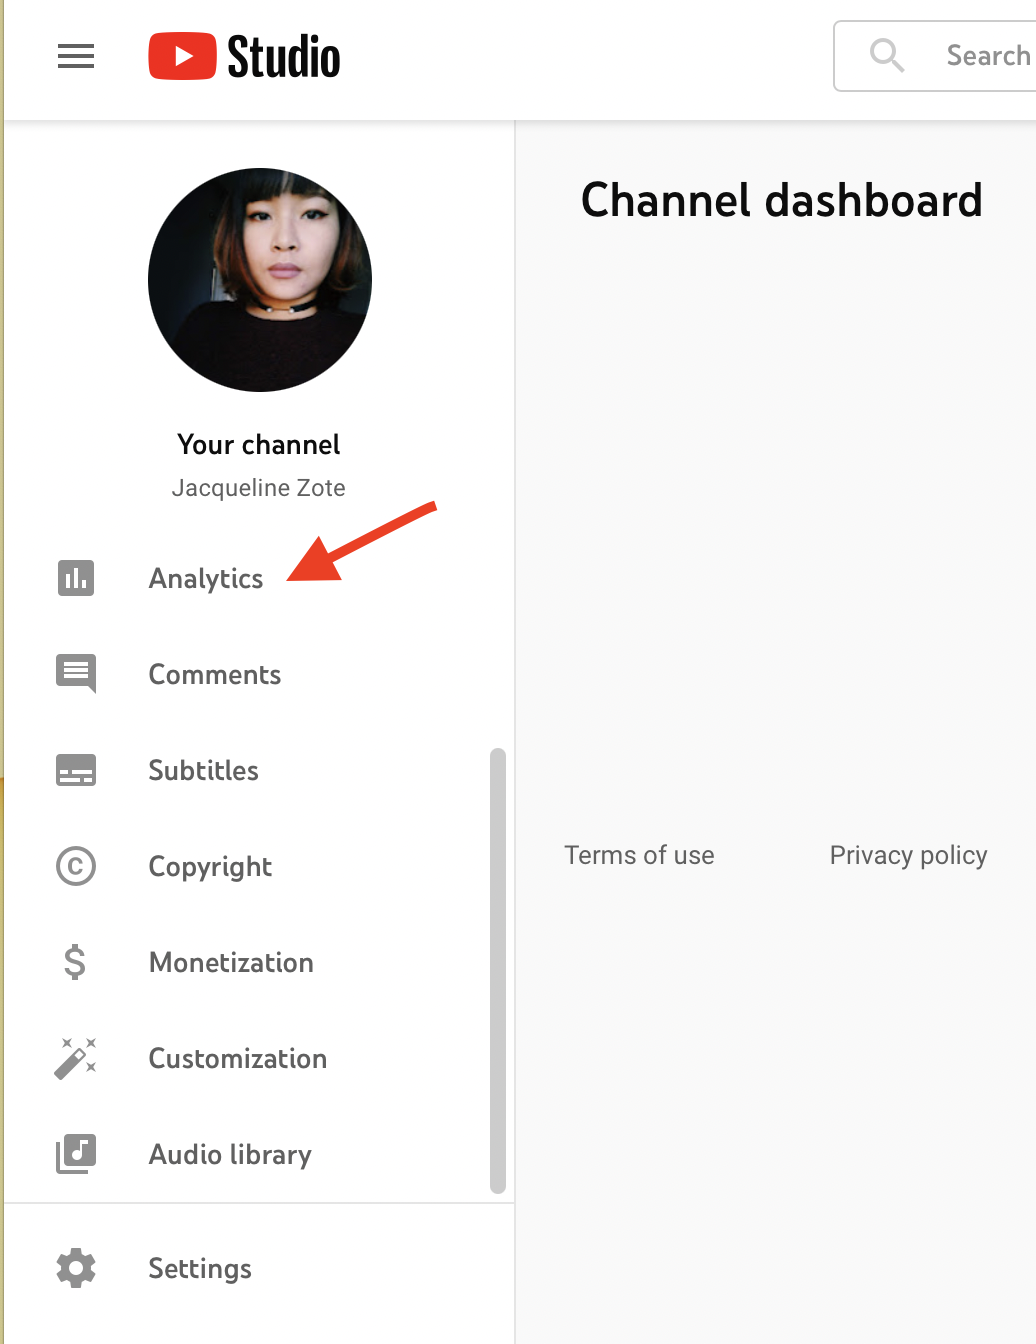
From your YouTube Studio dashboard, click on “Analytics” in the left-hand panel to open your YouTube analytics. This will give you an overview of your channel performance. You can click on the “Advanced Mode” or “See More” option to get more detailed YouTube channel analytics insights.
How to access YouTube analytics on mobile
To view your YouTube analytics using a mobile device, you’ll need to use the YouTube Studio app. Download the app from the App Store or Google Play and sign in to your account. You’ll get an overview of your channel analytics. Tap “View More” to open more detailed analytics reports.
YouTube analytics general reports
The YouTube analytics tool is robust.
It tracks a variety of metrics at a channel, content and audience level. This can get a little intimidating for beginners.
General reports within YouTube Analytics can be a simple way to uncover a wide range of insights. In this section, we’ll break down the most important general reports.
Channel overview report
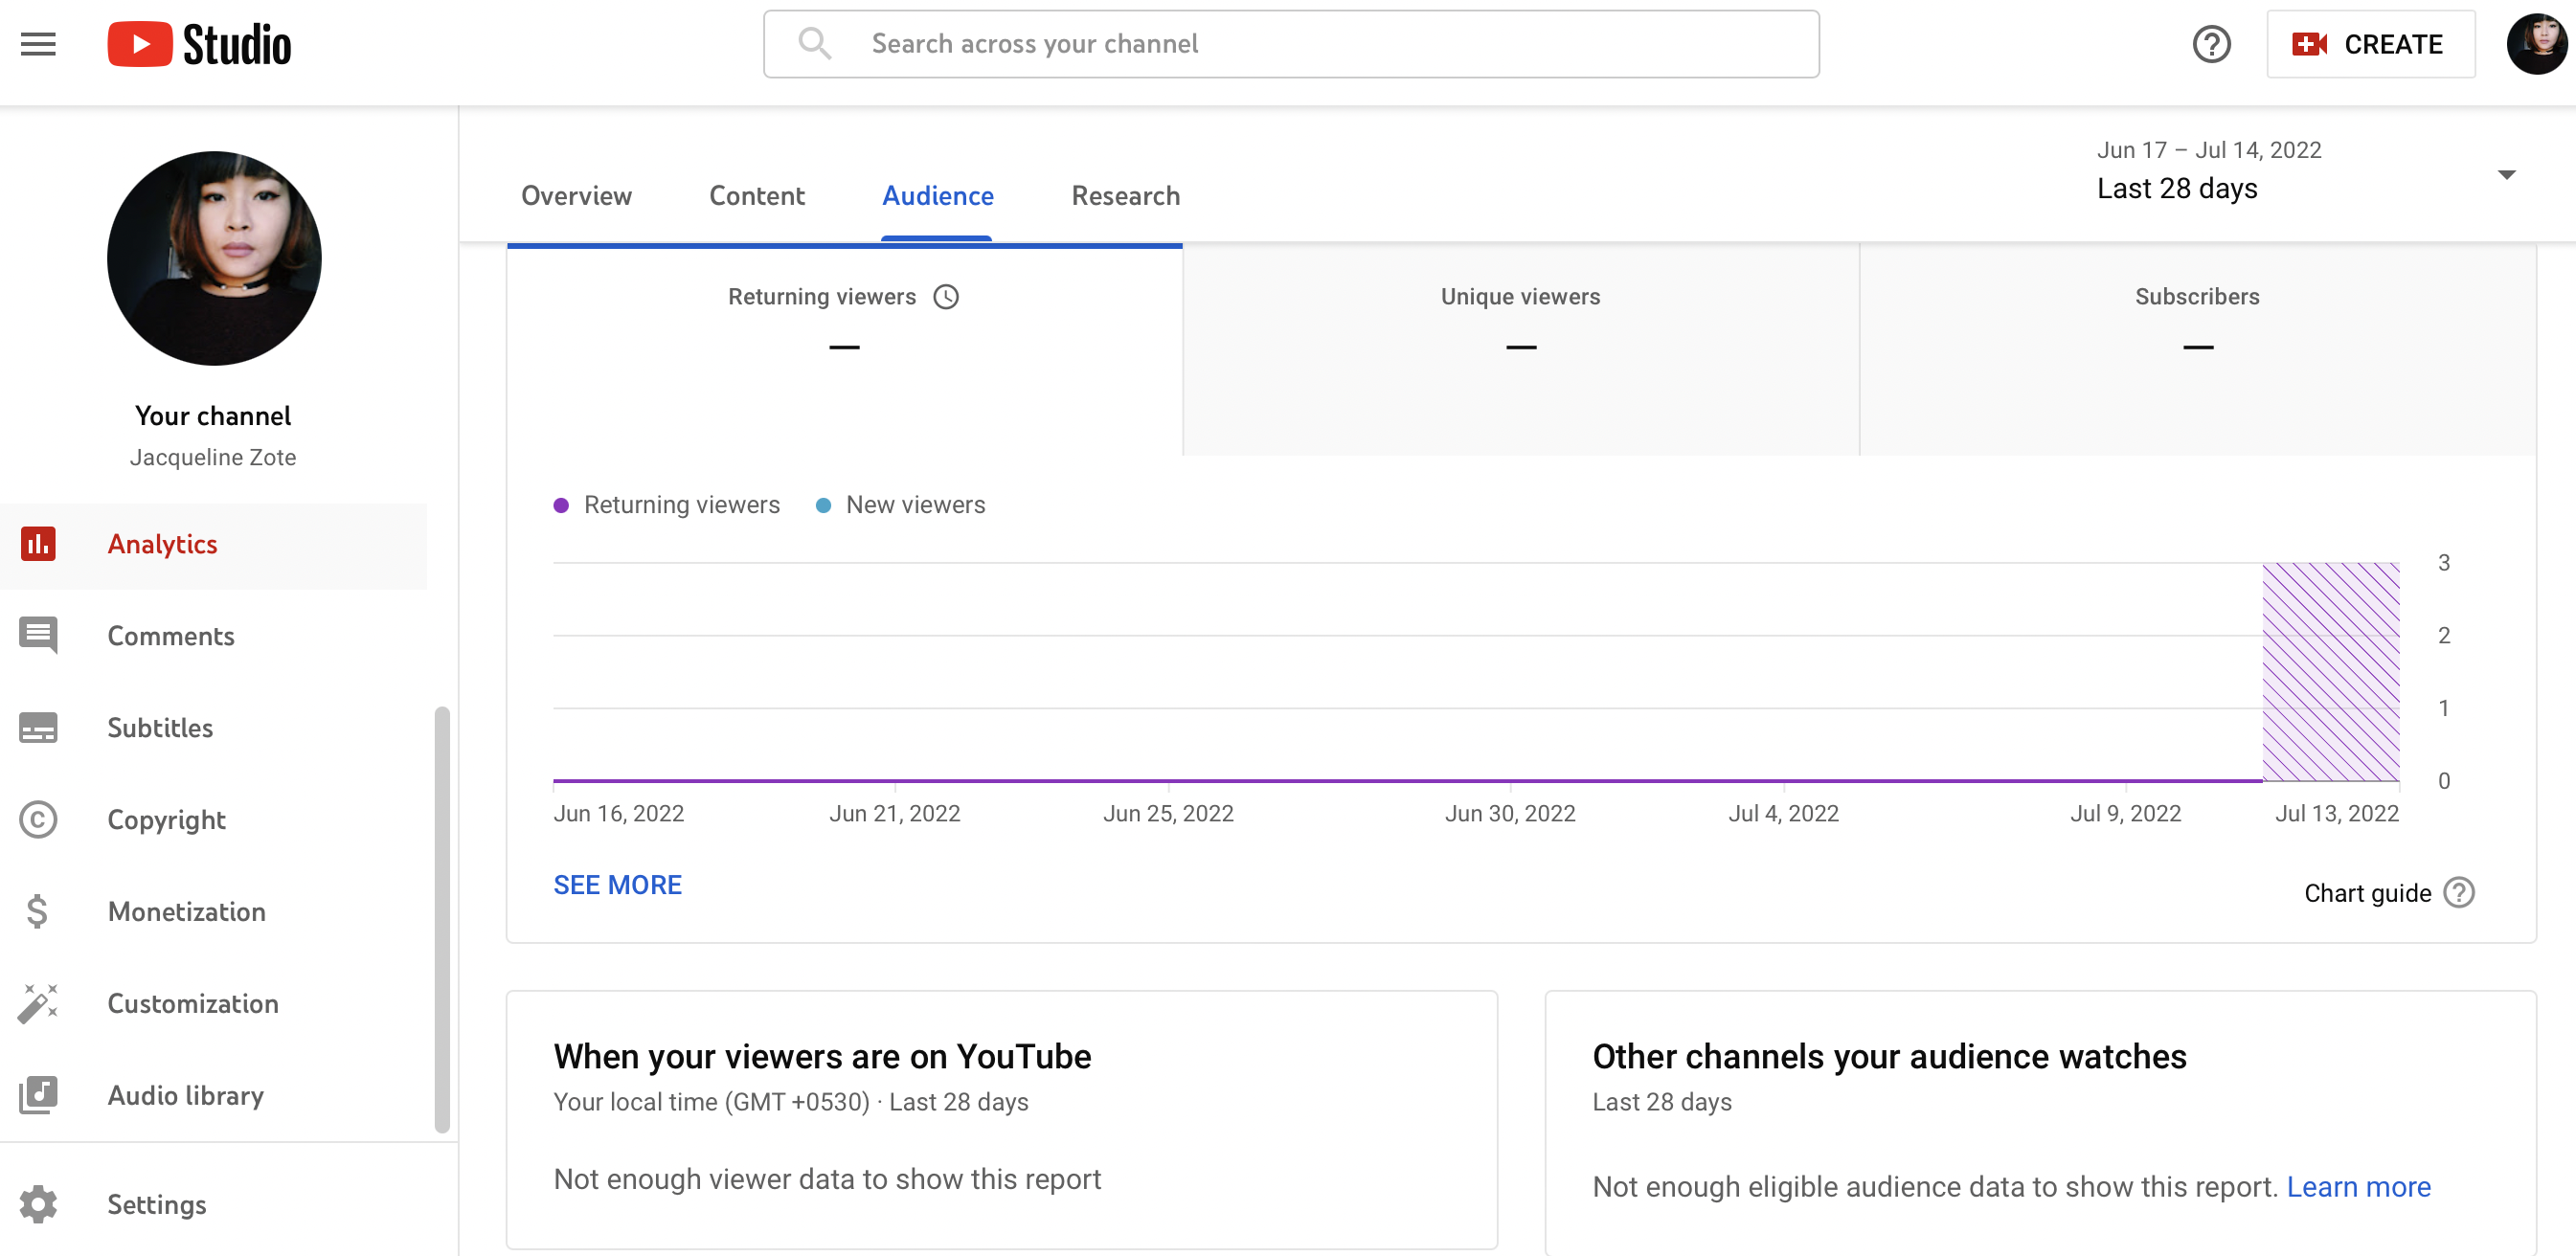
The channel overview report is the first thing you’ll see on your YouTube analytics dashboard. As the name suggests, this gives you an overview of your YouTube channel analytics over the last 28 days.
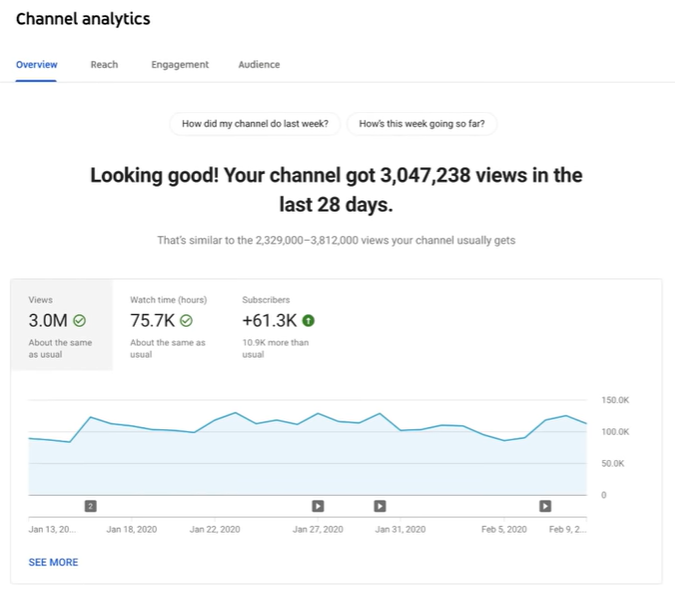
From the Overview tab, you can view the following metrics:
- Views: This shows you the total number of views your channel received.
- Watch time: This tells you the total number of hours people watched your videos.
- Subscribers: This shows you how many new subscribers you’ve gained within the given period.
Below each metric, you’ll also see how the number compares to previous periods, so you can instantly tell if there’s a growth or decline. For example, you may be able to see that you have a higher subscriber growth than usual. This might be because of a highly successful video you recently published. It may also be because you made a few tweaks to your YouTube marketing efforts.
Realtime report
No surprises here. This report shows you an estimate of view count data for your most recent videos, including people-watching in real-time. If you’re pushing out video content on a frequent basis, this report can let you know if any new videos are experiencing a spike in engagement.
The Realtime report displays two graphs: one hour-by-hour and the other minute-by-minute. Both graphs refer to viewers’ local time zones.
YouTube analytics: Watch time and audience reports
These two reports are arguably the most important for YouTube promotion.
Because if viewers are eating up your content with high watch times and retention rates, you know you’re on the right track. Although these metrics aren’t the end-all, be-all of your YouTube analytics, they’re vital for fine-tuning your video strategy.
Watch time report
This report aggregates data from all view sources to create a comprehensive breakdown of viewer retention. These sources include the YouTube homepage, the platform’s embedded player and the mobile YouTube app. You can also compare watch time data for individual videos.
Some noteworthy watch time metrics include:
- Average view percentage: The average percentage of a video watched during playback
- Average view duration: The average length, in seconds, of video playback
- Estimated minutes watched: The number of minutes users watched videos for the specified channel, video or playlist
- Uniques: The number of unique viewers that watched a video. This is calculated based on the number of unique cookies and will over-count users who are using multiple devices or browsers
- Viewer percentage: The percentage of viewers who were logged in while watching the video or playlist
- Views: The number of legitimate views for your channels or videos
- Watch time: The amount of time that a viewer has watched a video
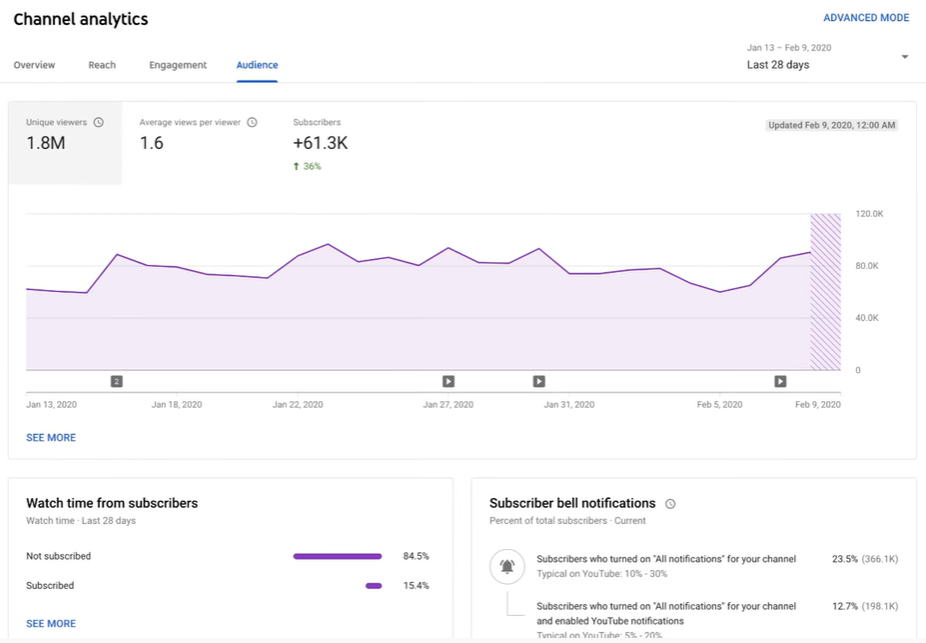
Audience retention report
This report helps you understand whether or not your viewers are sticking to your videos.
Based on these metrics and percentages, you can start to look for common threads among your top-performing content. On the flip side, you might spot a correlation between videos with lower retention.
Beyond big-picture trends, the absolute audience retention curve lets you see which parts of the video are most popular. YouTube recommends paying close attention to the first 15 seconds of every video given that’s when most viewers will drop off. You can also use relative audience retention to see how your video compares to YouTube videos of similar length.
Retention is further broken down by organic traffic, traffic for paid skippable video ads and traffic for paid display ads. Some noteworthy metrics for the report include:
- Organic traffic: Video views that are the direct result of user intention. Traffic is considered organic if a viewer takes an action like searching for a video, clicking on a suggested video or browsing a channel.
- Skippable video ad: Views for ads that are auto-played before a video and are skippable after five seconds.
- Display ads: Views in which the user played the video from a display ad, including ads shown in search results or on other video watch pages.
Retention metrics provide actionable insights on what you can do to improve your YouTube videos.
Perhaps your videos lack that initial punch in the first few seconds. Maybe you start off strong and lose viewers halfway. These details are exactly why regularly checking your YouTube analytics audience report is a must.
Playback locations report
This report is interesting if you work with collaborators or partners. Here you can see where your videos are being played, either natively on YouTube or embedded elsewhere.
For instance, you can see how many views are generated through embedded videos on other websites and on YouTube directly. If it was viewed on YouTube, you can determine whether it was viewed from the video’s specific page or directly on a channel’s page.
Simply put, playback reporting highlights where users are viewing your videos while the traffic sources are how people find your content. The noteworthy metrics of this report include:
- YouTube watch page: The video was watched on YouTube from the video’s specific page. It’s the exact URL where you can watch the video on YouTube.
- YouTube channel page: These are views directly on a channel page (ex: youtube.com/user/SproutSocial).
- YouTube other: Certain browsers don’t let YouTube detect where on the platform the video was viewed. Most likely these views occurred on the YouTube watch page.
- Embedded in external websites and apps: How often viewers watched your video when embedded on another website or app that embeds your videos (see example below).
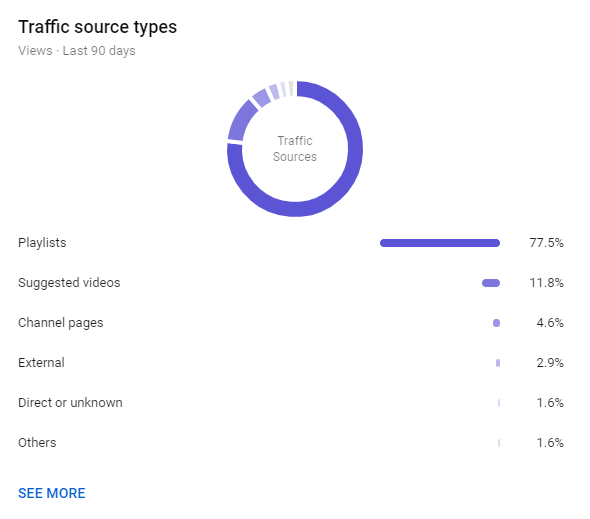
Traffic sources report
Another key report to keep an eye on is the Traffic Sources Report. It shows the sites and YouTube features that viewers used to find your content.
Understanding whether viewers are searching directly on YouTube, clicking Suggested Videos thumbnails or following links from social networks lets you know if your optimization and promotion strategies are paying off.
Devices report
Last but not least, you’ll want to add the devices report to your list of regularly pulled reports. This report gives you information on the different devices—including PCs, mobile, tablet, game consoles and TVs—and operating systems that viewers use to watch your videos.
This data can better inform both your advertising and outreach strategies. Likewise, it also influences the type of content you’re sharing. If a majority of your views are from mobile devices, you may want to swap those 20-minute tutorials you’re creating for shorter, bite-sized content.
Analyzing “where,” “when” and “how” people are tuning in speak to the importance of a tool like Sprout Social. For example, our YouTube publishing features allow you to optimize your content and post timing based on audience engagement. Also, you can easily cross-post your video content from social to YouTube and vice-versa.
YouTube analytics: Engagement reports
Views aren’t everything when it comes to video performance. Engagement reports within YouTube analytics show how viewers are interacting with your content. Engagement metrics that are tracked within YouTube analytics include:
- Likes
- Dislikes
- Comments
- Subscriptions
- Sharing
Subscribers report
Hey, we’re all obsessed with our follower counts, right? This report is YouTube’s equivalent, outlining how you’ve gained and lost subscribers across different pieces of content, locations and dates.
This report quite literally tells you which content is scoring subscribers and where they’re coming from. You can also see where you lost subscribers as well.
Likes & dislikes report
This report is fairly self-explanatory but it’s worth highlighting. It shows the net change of likes and dislikes in your videos. It adds up the number of likes and dislikes minus the number of likes and dislikes removed.
Your approach to engagement on YouTube should be a holistic one: if you’re not getting a high number of likes, don’t freak out. After all, viewers might be sharing or commenting more than they’re liking.
However, you should be concerned if your videos start netting dislikes out of the blue. Occasional dislikes from trolls and potential competitors might happen, but if you aren’t baiting people you shouldn’t expect a flood of hate for no reason.
Videos in playlists report
This report shows you how many times your videos were added to or removed from viewers’ playlists. This includes default playlists, like “Watch Later” or “Favorites,” as well as any custom playlist.
Knowing which playlists your videos are included in is a nice added bonus. For example, if you notice that your long-form tutorial videos are frequently being queued up by others, perhaps it’s time to create even more.
Some noteworthy metrics in this report include:
- Average time in playlist: The estimated average amount of time, in minutes, that a user viewed videos in a playlist after the playlist was initiated. This only includes playlist views that occur on the web.
- Playlists starts: The number of times that viewers initiated playback of a playlist. This only includes playlist views that occur on the web.
- Videos added to playlists: The number of times videos were added to any YouTube playlists, including the video owner’s playlists or other channels’ playlists.
- Videos removed from playlists: The number of times videos were removed from any YouTube playlists.
- Views per playlist start: The average number of video views that occurred each time a playlist was initiated. This only includes playlist views that occur on the web.
Comments report
This report summarizes how many people comment on your video.
Just like social comments, the YouTube comment section represents a place to go back-and-forth with your audience. It’s also somewhere to gain unfiltered insight into how people feel about your content.
If people are showing you love in the comment section, make sure you respond accordingly. Response time is critical, especially for customer support and tutorial videos.
Sharing report
This report shows how often your content has been shared through the “Share” button on YouTube and other sites like Facebook or Twitter.
Sharing is obviously a key component of promotion, especially if you’re publishing content such as product-centric videos or breaking news. If you’re actively scheduling and promoting your YouTube content across your social channels, this report is definitely one to watch.
Cards report
Despite popular belief, videos don’t need to be a totally passive experience for viewers.
Serving as an alternative to now-discontinued Annotations, marketers can make their YouTube videos more interactive through the use of Cards. Depending on the Card type, you can add in either an image, title or call-to-action.
This report shows you how viewers are interacting with cards on your videos across desktop, mobile and tablets. Notable metrics for this report include:
- Clicks: The number of times that cards were clicked.
- Click rate: The clickthrough rate for cards, which is calculated as the ratio of card clicks to card impressions.
- Impressions: The number of times cards were displayed. When the card panel is opened, a card impression is logged for each of the video’s cards.
- Teaser click rate: The clickthrough rate for card teasers, which is calculated as the ratio of clicks on card teasers to the total number of card teaser impressions.
- Teaser clicks: The number of clicks on card teasers. Card icon clicks are attributed to the last teaser displayed to the user.
- Teaser impressions: The number of times that card teasers were displayed. A video view can generate multiple teaser impressions.
YouTube analytics: Earnings reports
Businesses posting relevant, ad-friendly content should obviously keep an eye on their earnings.
If you’re a YouTube partner with an associated AdSense account, you’ll have access to a couple of additional reports on how much you’re bringing in.
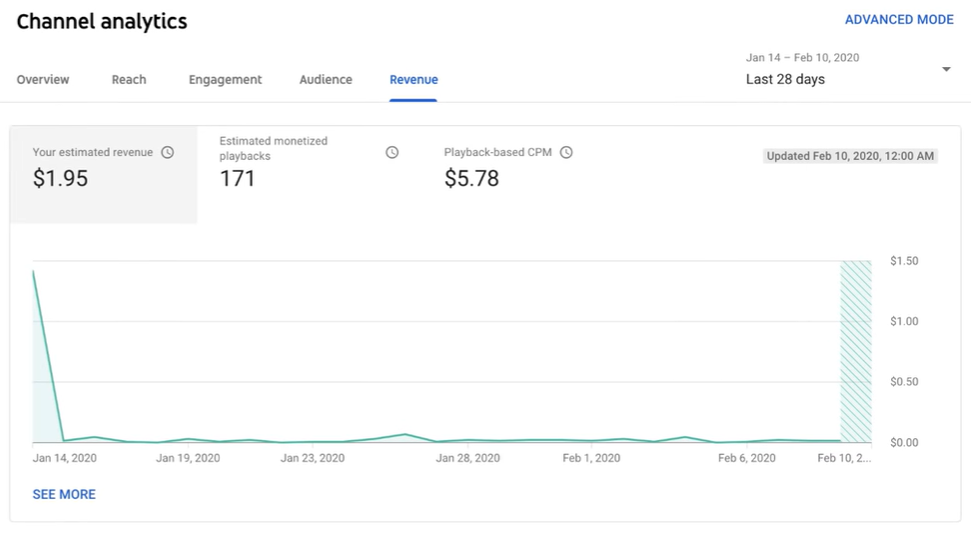
Estimated earnings report
This report details earnings related to partner content, transactions, YouTube Red and ads. Some noteworthy metrics within the report include:
- Ad earnings: The total estimated earnings (net revenue) from all Google-sold advertising sources for the selected date range and region.
- Earnings: The total estimated earnings (net revenue) from all Google-sold advertising sources as well as from non-advertising sources for the selected date range and region.
- Red partner revenue: The total estimated revenue earned from YouTube Red subscriptions for the selected report dimensions. It reflects earnings from both music and non-music content.
YouTube notes that estimated revenue in YouTube analytics may not be identical to finalized payments due to final adjustments during the payout period.
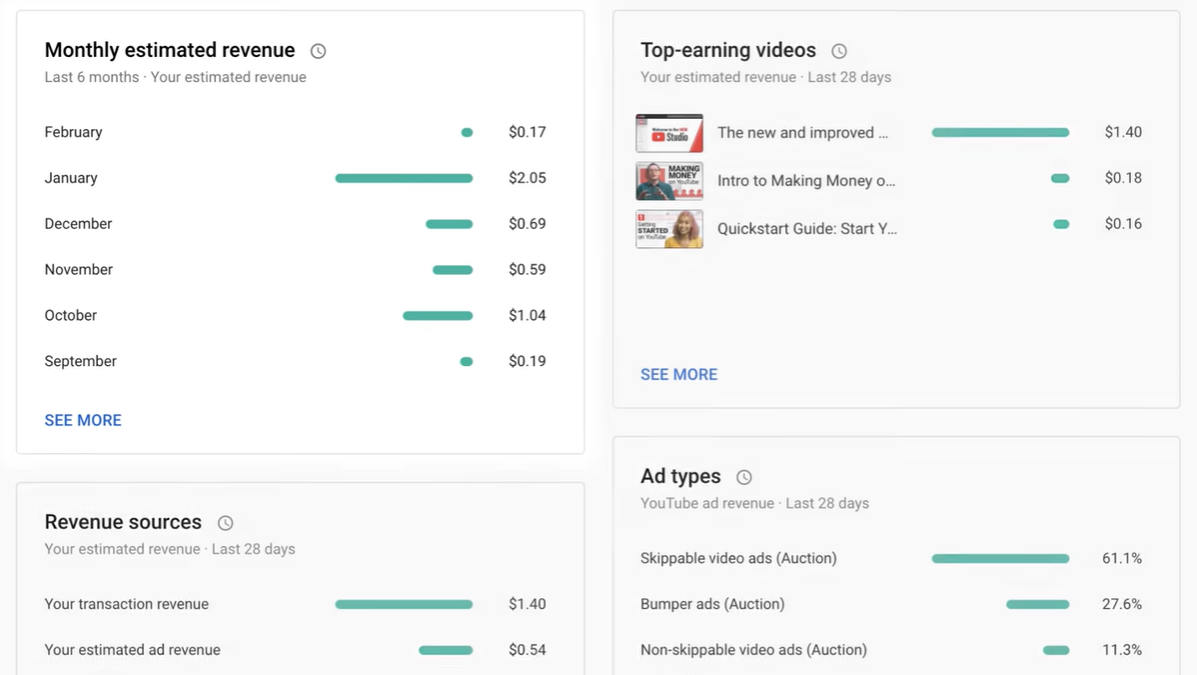
Ad rates report
This report determines how different ad types perform over time compared to one another. A few noteworthy metrics within the report include:
- Ad type: The format of the ad in question and its buying platform.
- Ad impressions: The number of verified ad impressions served.
- Monetized playbacks: The number of instances when a viewer plays your video and sees at least one ad impression. A monetized playback is counted if a viewer is shown a pre-roll ad but quits watching the ad before your video ever starts.
- Playback-based CPM: The estimated gross revenue per thousand playbacks.
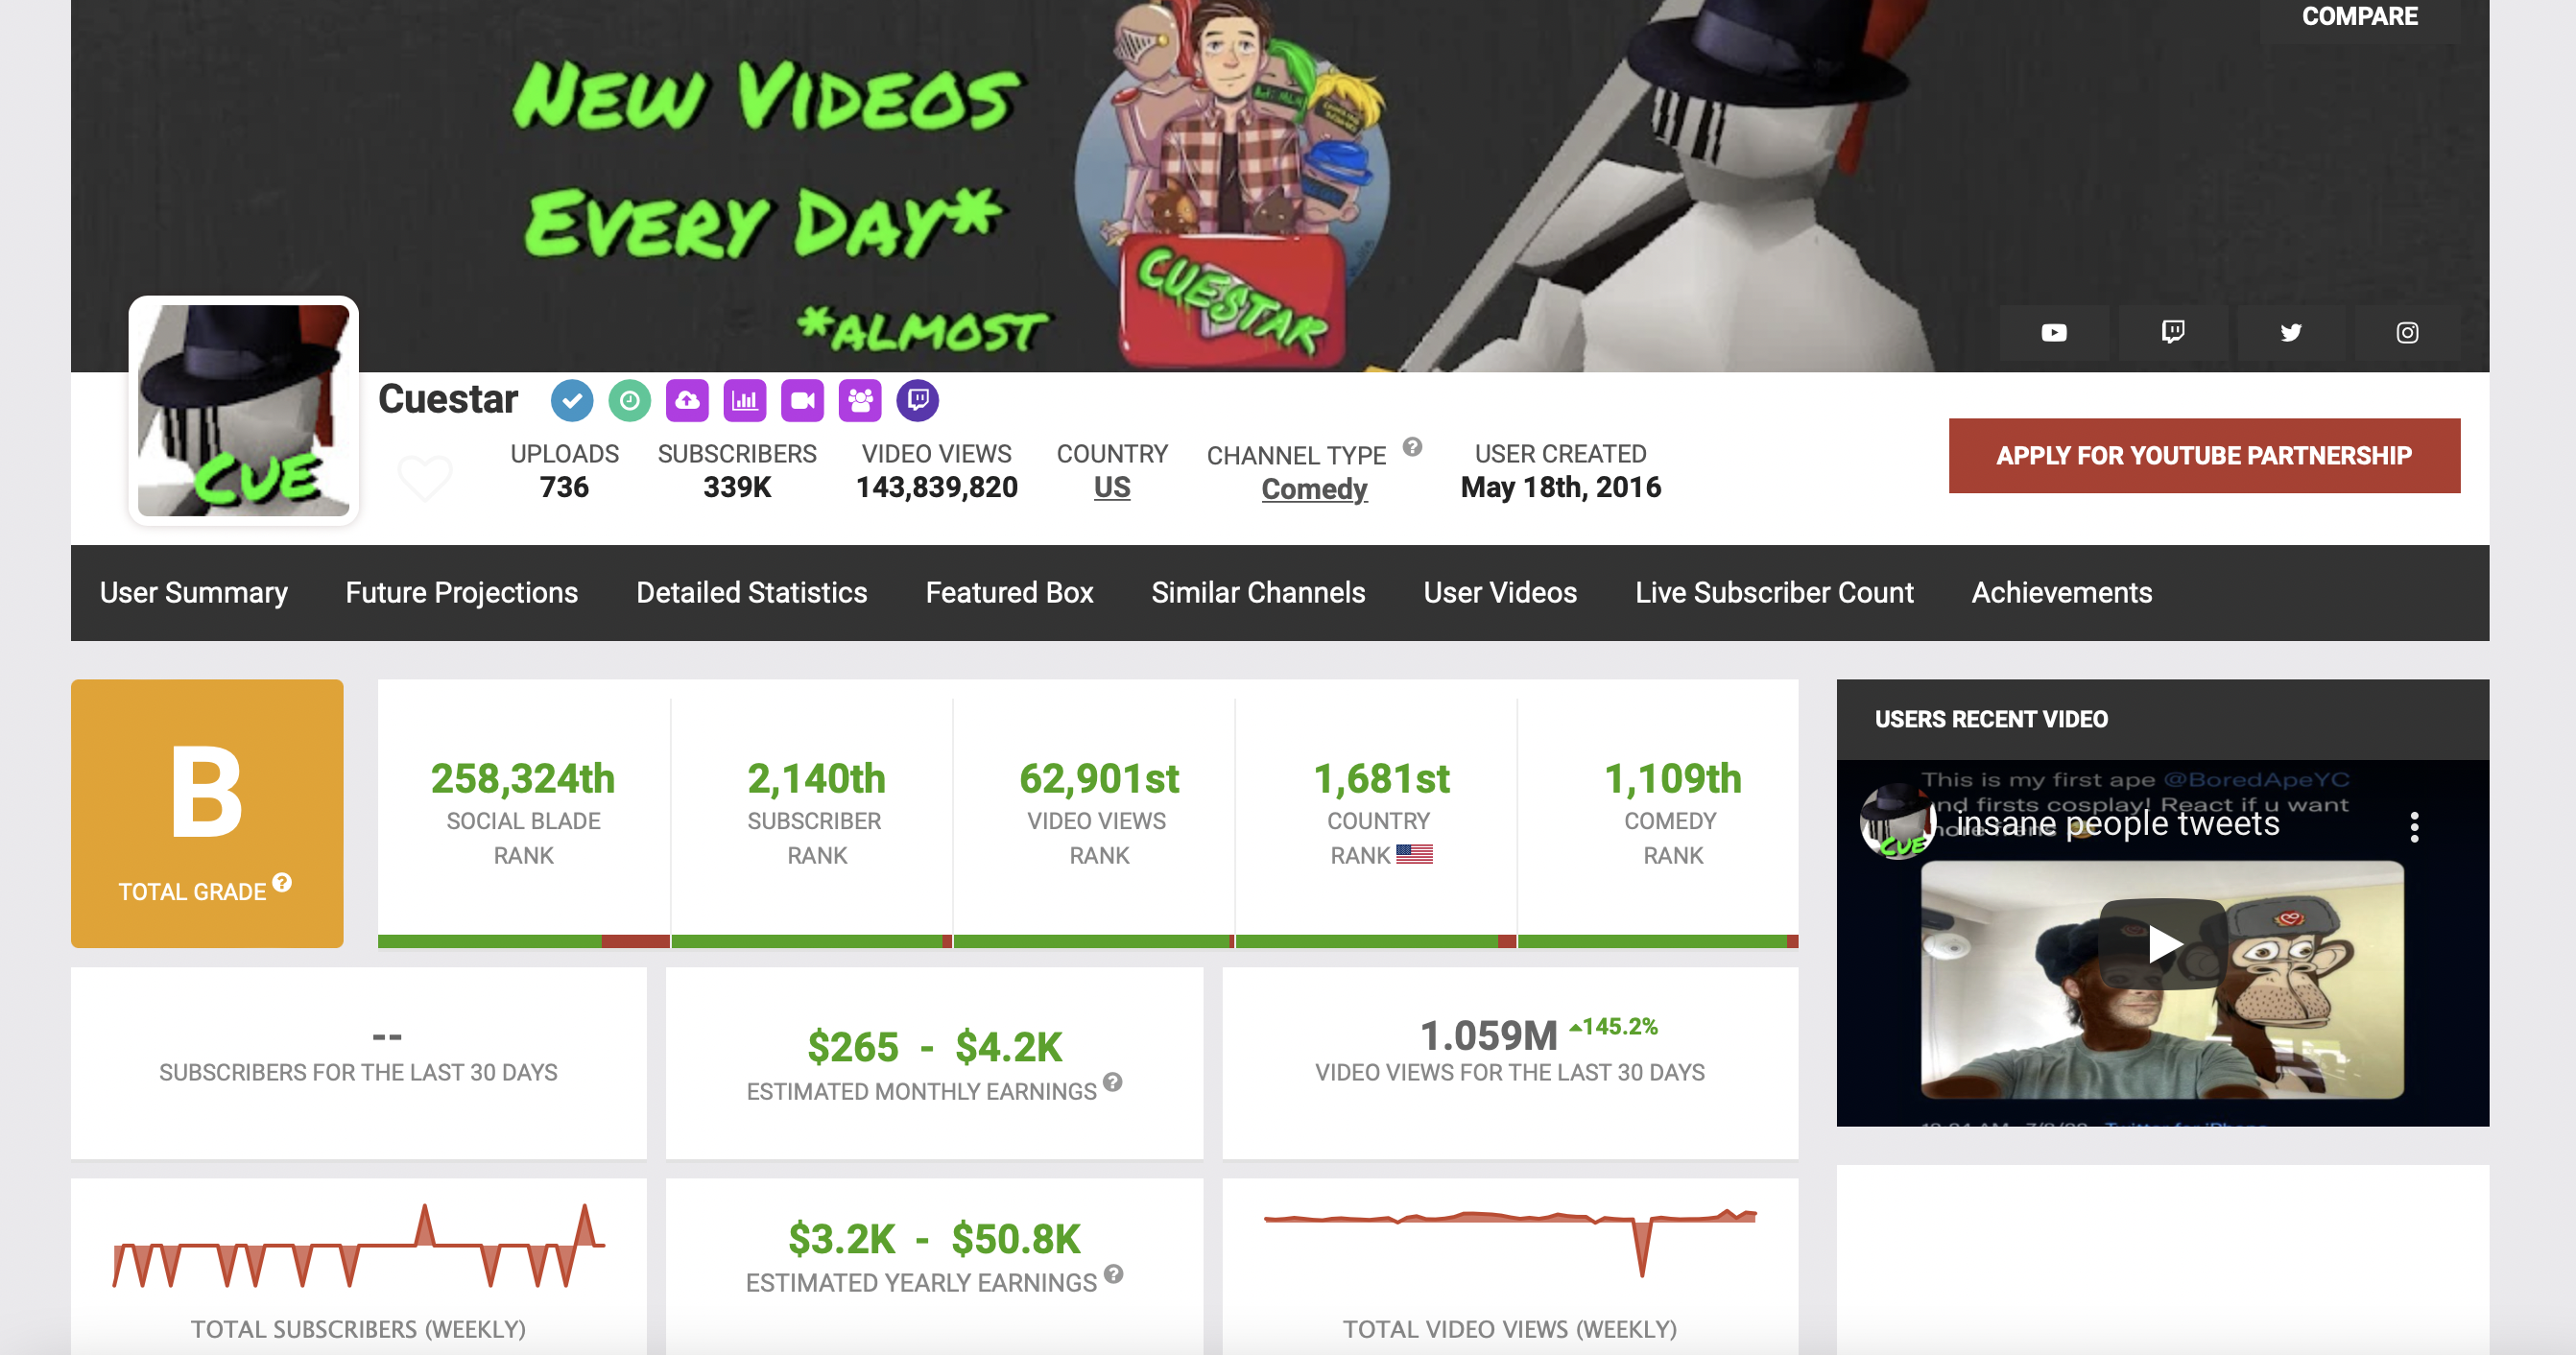
How to access YouTube analytics for competing channels
Besides viewing your own analytics data, you may be interested in finding out how your competitors are performing. For this, you can use a third-party platform to access competitor data. Just enter the channel name in the search bar and the tool will pull up comprehensive analytics insights into the channel’s performance.
So, you’ll be able to see how you stack up to the competition in terms of monthly video views and subscriber growth. You can also see their most viewed and highest rated videos to see what’s working. Use this to inform your content strategy and create more videos that engage your audience.
YouTube analytics tools to level up your strategy
The native YouTube analytics dashboard is robust. However, it doesn’t show you how your YouTube marketing strategy is contributing to your overall social media marketing efforts. You can use more sophisticated YouTube analytics tools to address this gap.
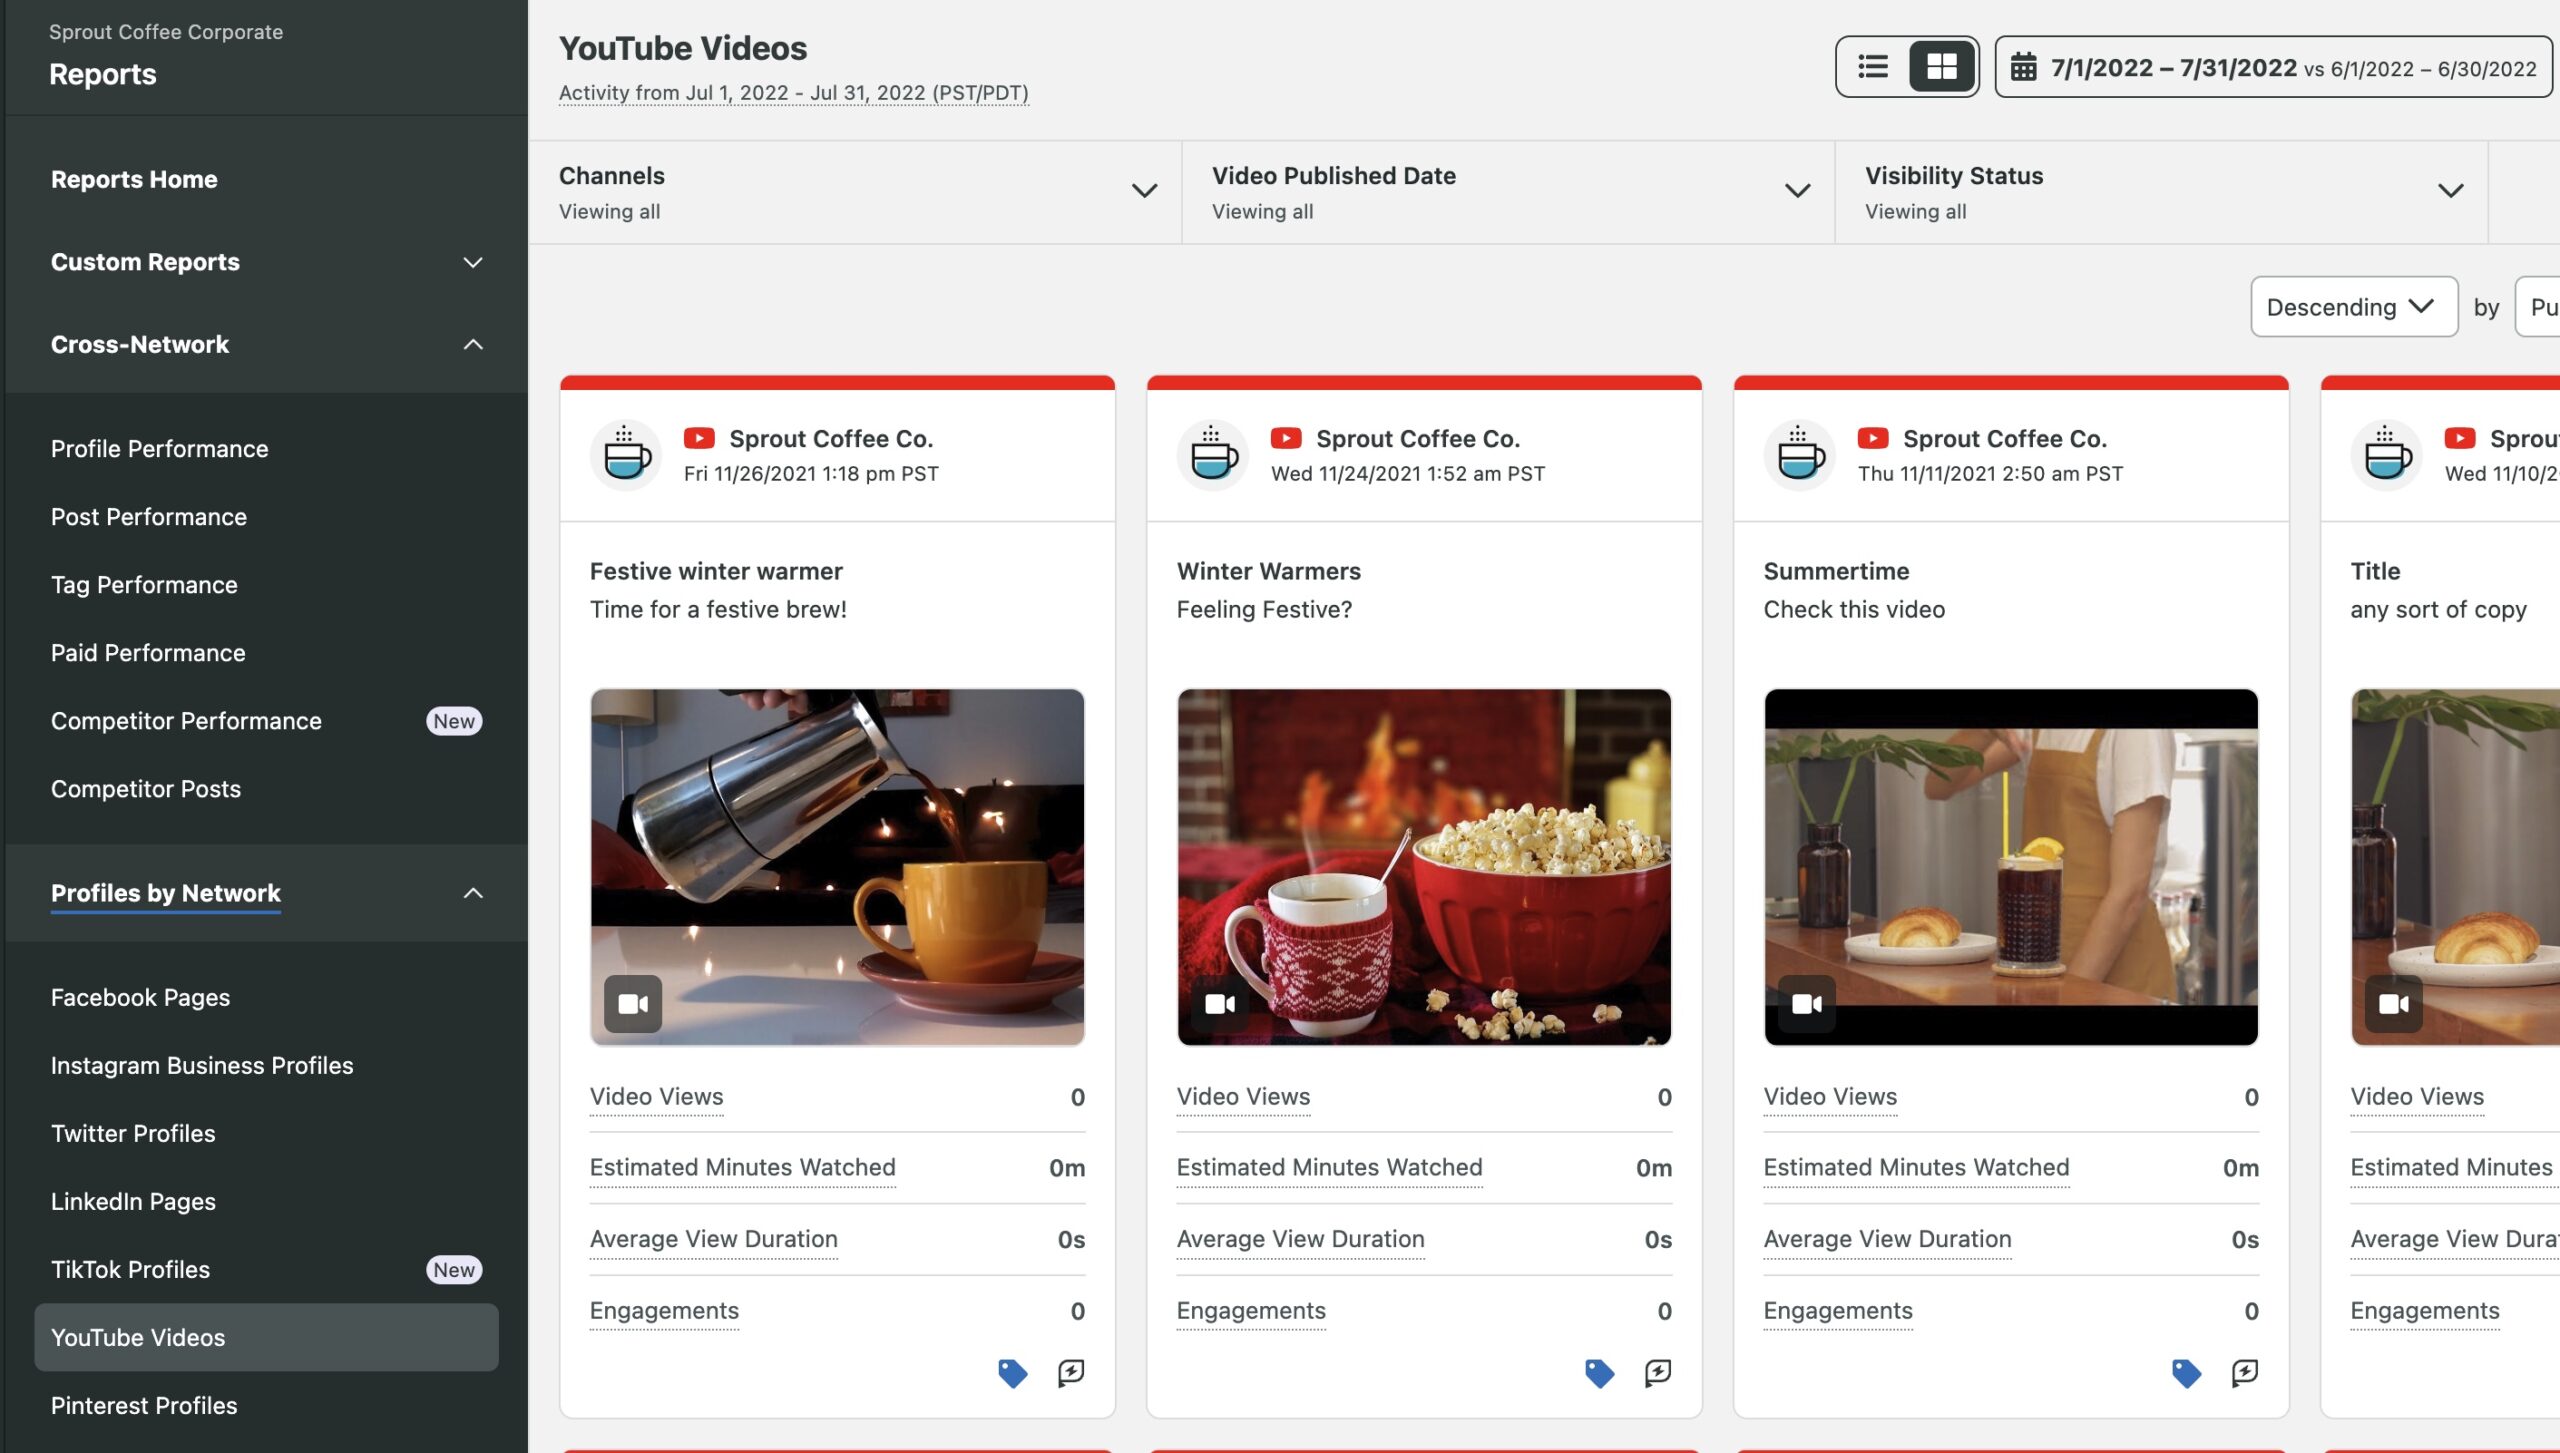
Sprout Social
Sprout offers powerful tools to analyze your YouTube performance. It lets you easily visualize your content performance across channels to see exactly where you stand. You can also gain video-specific insights to understand how to improve your publishing and engagement efforts.
Google analytics
Google analytics can give you a more detailed look into your channel performance. You’ll be able to track how people are interacting with your channel page and how they’re converting on the page. You can also track the traffic coming from your YouTube videos to your website.
Grow your channel with Youtube analytics
We get it: there’s a lot to take in!
But YouTube analytics can inform your strategy and amplify your marketing efforts.
Consider using a tool like Sprout to help you step up your YouTube marketing. From cross-publishing and asset management and beyond, our platform allows you to seamlessly combine your YouTube strategy with your social campaigns.
So if you haven’t already, take a test drive of Sprout Social today to see our full suite of YouTube features in action.
The post YouTube analytics: How to analyze data to improve your marketing appeared first on Sprout Social.